
Podcast Overview
-
Eric Guidice (00:01)
Ladies and gentlemen.
One of our most anticipated headcount experts episodes to date. My name is Eric, founder of Headcount 365. We are headcount infrastructure for your hiring plan, your headcount across any ATS HRIS. I'm of course joined by Chris Mannion, founder of Meander, MIT alum, headcount expert, and we are joined today by this is gonna be one of my longer intros, Cole Napper, our most decorated people analytics voice that we've had on the podcast.
podcast to date.
You're currently the Chief People's Intelligence Officer at HR Bench. You've worked for FedEx and Orgnostic. You are a PhD in organizational psychology. have a book called Using Data Driven HR and Gen AI as a business asset, you run the directionally correct.
Podcast, which is almost at 200 episodes, might be, by the time this comes out. you have a newsletter on Substack, also called Directionally Correct, and have a number of teaching, speaking, and podcast engagements. The most recent obviously is headcount experts. Welcome to the show. Thank you for joining us.
Cole Napper (01:10)
Thanks for having me, Eric. Thanks for having me, Chris.
Eric Guidice (01:13)
Before we get into segment one, which we will kick off shortly, give us a little elevator on Cole Napper. How do you, when you go on podcasts, how do you describe yourself and what you do?
Cole Napper (01:24)
I mean I think you did a fairly good job of it. It's hard. I I always feel like I have to like leave parts out. And or I just frankly I forget them. this de p kinda depends on who I'm talking to, but yeah, I think
For this this sake is probably my biggest credential is that I do a podcast. I feel like having a bunch of reps on doing podcasts makes it different. Like when I'm the host usually I can tell if somebody's been on a podcast before like five or ten times. Quitatively, it's a completely different experience. And so hopefully that'll make today's conversation somewhat seamless.
Eric Guidice (02:00)
We like experts.
We are a big fan of people who've spent a long time doing a focused discipline so that we can extract from that the most broadly applicable, the forward looking intelligence that helps people be better at their job, maybe learn something, maybe drives them towards people analytics if they're on a fence. and so we have three segments. The first, of course, is hot jobs. Now I've curated a number of current openings that have something.
Talk about as a function of the jobs. And so before I get into the individual jobs, I've noticed a few things that I'd love your feedback on. So as I went through the people analytics job space, I noticed that
Some
jobs are just people analytics, and some jobs are people analytics combined with other things. We're gonna get into it on some of the specifics, but what's your take before we even get into any individual job on something being a pure people analytics role and it being shared with some other part of the HR talent or operational experience?
Cole Napper (03:06)
Yeah, I think that that's that's been the case for a while. That's not a new phenomenon. In the past, it was usually just because many organizations, especially smaller, maybe they're not as an advanced HR function. they'd lump in people analytics because they just couldn't afford to have like a dedicated person or entire team to that function. And so it was like an and, not necessarily an or. But I would say
More recently why you're seeing this is actually because of all
The thesis I put out there is what I c I call the People Intelligence Manifesto, which means that the barriers between people analytics and all of these other disciplines are collapsing in front of our eyes because of the introduction of AI and being able to bring in a singular int data layer for a firm and then the intelligence that cuts across that data layer, all the the silos that have existed between people analytics and other disciplines are just evaporating. And that and so that and starts to make a little bit more sense.
I think we're gonna coalesce eventually around this title of people intelligence, which kind of combines that historical workforce planning, people analytics, talent intelligence, and behavioral science together into one. but I think yeah, it it's an interesting phenomena. as much as I don't like a bunch of ands and a job title, it it's probably necessary at some times.
Eric Guidice (04:27)
Well, you mentioned, I think, maybe in that similar manifesto that you see a general shrinking of people analytics teams. Like there should never be a fifty or a hundred person people analytics team again as AI
Cole Napper (04:39)
Mm.
Eric Guidice (04:40)
starts to drive productivity and outcomes.
Cole Napper (04:43)
I mean, there never should have been. Like I I the some of these teams they they got up to absurd numbers. I mean, there were teams over two hundred, three hundred people. There's not enough work at any one organization for three hundred people to do. Like and so I I I see first of all th there was gonna be a a necessary correction to that and that correction a actually happened before generative AI really entered the equation in in a large way, because it really happened between kind of twenty twenty one through twenty twenty four and AI really
really didn't start to hit its stride, I feel like, till, you know, maybe beginning of last year, I think would be the the most confident point. So realistically though, if you're a small organization, you never need more than probably three people in your function plus a good technology stack. If you're a very, very large organization, maybe I can make the case for twenty people, maybe. You're still probably gonna have some redundancy in there, I feel like. but yeah, I think there was a necessary correction that that
That's really we're still seeing it unfold before our eyes.
Chris Mannion (05:41)
curious if you if you see like a
Eric Guidice (05:41)
Yeah, I'm c I'm go ahead.
Chris Mannion (05:43)
a risk of going too far the other way you know we we you always see this like you know the the the demand kind of spike and trough and how will we know if we've gone too far in reducing team sizes and what's going to be the impact of that I always think about the the Dunning
Cole Napper (05:56)
Yeah, I mean you can
Chris Mannion (05:57)
Kruger effect of like if every every manager thinks they know what's best like how how will how will they know and essentially like what is the value the value differential between not having the right size people team
You want our text team.
Cole Napper (06:11)
Yeah, I mean I I would say I would go upstream of that. You know you know you're cutting to the bone if you're expecting to have intelligence like outputs but not having the right infrastructure in place. Right? So like if you don't have all of your data together, you can't have the expectations that you would get insights from having all of your data together, and so that would be cutting to the bone, right? You you wouldn't want to do that.
I I there's this interesting notion, you you brought up managers, so I think it th I've had this conversation with a few folks now, which is historically the value creation function of people analytics was to be the builders, the product type function that was going to take that and democratize it out to the firm. And we're really seeing this shift that
It's trying to create enablement for the users themselves to be the builders if they so choose. That's a different value creation function, but arguably you could say that if you're enabling that building to happen at scale, you're actually creating more value on net than if you just have one centralized team. I I think there's some downsides to that potentially as well, but it is an interesting model that I've been talking to a few kind of the leading AI firms about.
Eric Guidice (07:20)
I think one of the interesting thing about the jobs this week, when I look at the span of who's hiring people analytics,
Cole Napper (07:27)
Mm.
Eric Guidice (07:27)
I see companies as small as a thousand folks having directors or senior directors, sometimes in a niche part of people analytics, like focus only on capacity or only on people analytics. all the way up to I think GE Healthcare is one of our larger this week, where they have a leader of AI workforce intelligence and Red Bull having a a senior manager of
Talent planning and analytics. And so I pulled up a couple. I wanted to share some of the jobs that we pulled up and get some of your reactions to.
these roles and we'll go here first. So with each one, right, we have something interesting to talk about. And I think one of the themes I saw with the jobs this week was there is a difference, the the se the more senior you get into the position, the less it becomes about the people analytics and the more it starts to drive towards storytelling.
and so there was one thing that stood out to me about this one is this partnering with finance. and so when you're in your when you're advising people analytics, when you're doing your job yourself, how much of it is insular to just the people function and how much of it is a partnership with finance?
Cole Napper (08:42)
I would put finance as a part of partnerships across the entirety of the business. And so one of the things that I've been playing around with this notion is that a very popular role I'm sure if you guys talk about roles all the time on your podcast, it's probably come up as the forward deployed engineer. And
Eric Guidice (08:59)
That's correct.
Cole Napper (09:01)
Yeah, before that term really even existed, the model that supports that type of role has existed for quite some time. It's i i I mean, I I believe Palantir created the role in like twenty eleven, but it really didn't get into prominence until like the last two or three years. And so the thing I would say is good people analytics teams in the past always were the ones who are willing to get their hands dirty and go out and meet with the business. Finance being kind of one of those stakeholders, but operations leadership, sales,
tech teams, R and D, what whoever whoever, if you're not having interfacing with the business in the way that you want to receive the results and embedding yourselves there and then giving the types of insights that will really help drive business decisions, you're you're probably not very effective. If you're just like what I call like a code jockey that's sitting behind your laptop and expecting to make much of a difference, it's probably not going to make much of a difference. And so I think you actually in that culling that I think Chris kind of alluded to earlier
I think a lot of the it was the people that were just kind of sitting behind their laptops that weren't producing a lot of value that you saw kind of see exit stage left from the field. And it's the people who've been making an impact that are kind of seeing try and true. It's funny you're bringing up some of these job descriptions that like I know people who lead these functions at these companies 'cause it's a fairly small field and I'm pretty well connected in it. So it's like I could like name the people who are like the leaders here. So I'm gonna try not to do that today because I don't want to put on blast.
Chris Mannion (10:24)
Ha ha ha.
Eric Guidice (10:25)
No, that's totally
fair. I think let's let's kind of let the conversation go naturally to where I think it'll go next is the idea. So one of the main topics that we'll cover later on in the podcast is you look at headcount.
as a combination of the people and the production, specifically the AI side, or at least as per a recent podcast, this was your your take. And so I'm interested to hear how you quantify the impact or the production with AI in the picture. But what was interesting to me as I was perusing the jobs is GE is hiring this leader of AI workforce intelligence. And so it's looks like it's a position that's traditionally people analytics, but it's focused only on the AI.
Do you have a take?
Cole Napper (11:14)
Yeah, I I mean I I know the hiring manager for this position, like I I know these folks. so the the thing I would say is this concept of what I'm calling AI workforce transformation is is it's rolling through
all of the different industries in in the economy like a wave. And so some of the companies that were kind of early in the space, they've been in in doing this type of work for a few years now, whereas others are just starting to get, you know, dip their dip their toes into the water. But the reality is everybody sees this, especially on the white collar side of things. I think it's gonna hit the blue collar companies a little bit later. Is AI's changing the fundamental building blocks of work.
And people are trying they're I think that they're trying to simplify the equation as like what does AI do and what does a human do? I think it's actually a lot more complex than that and there's much more of a gradient to it than truly, you know, AI does certain things and humans do certain things. I think there's gonna be a collaboration component. And trying to understand this requires a lot of different disparate sources of data that organizations already have.
But also it usually requires data sources that they've don't have or never thought of having or new sources related to AI and some of the kind of the emerging things that you see companies like I believe Ramp is one of them that are giving like token spin and tracking like LLM token usage for firms and things along those lines. And you know, we at HR Bench are doing things around what we call like tokenomics and trying to kind of manage out the headcount spin versus the AI spend and looking at this from like a cost benefit standpoint.
standpoint and really just like letting organizations get their arms wrapped around this type of work, it's very complicated and therefore you're seeing a lot of these AI workforce transformation roles crop up recently.
Eric Guidice (13:07)
Yeah, there there's two different takes that I'd like to get your input on. The first is the relationship between headcount and the hiring plan as an independent
piece.
Cole Napper (13:18)
You mean there's a relationship
there?
Chris Mannion (13:19)
Ha ha ha.
Eric Guidice (13:20)
w
what I noticed in some of the you know research I've done on your on your previous positions is that headcount is more payroll in the way that you typically have looked at it, right? So it's from it you know, coming from the payroll system as someone who's there versus potentially the the connection of someone from payroll through the backfill process, the attrition to AI or the attrition to backfill process. And so I'm curious to know as AI starts to step
into the kind of forefront of analytics planning or headcount planning, how does the relationship between the the existing headcount and the hiring plan kind of influence the people analytics space in the future? So that's kind of one one side of it.
Cole Napper (14:02)
Yeah, I wouldn't necessarily say headcount is is as payroll. I payroll is a component of it. I would think in terms of like FTEs, so like full time equivalents, you know, you've got to think about like okay, what's your standard W-2 kind of employee, right? They're working forty hours a week, then there's part-time, then there's contractors, then there's contingents, then then there's consultants, then there's, you know, any other kind of staff augmentation you can use there.
Then there's what's new in the equation is really what role is like an AI agent, right? And does it play a role as like a head in your headcount? And does it have a designated part in like an org chart? Or at least is it tied to like a particular workflow? And does it have money that's flowing to it? And do we have under wraps where that money is flowing, like you would have as the money flows and the the fringe benefits flow to a W-2 employee? I think that those are really key elements there.
The relationship to head count planning, I think it actually like I've always thought that head count planning was a quite linear process as long as you had a good demand function. Having a good demand function was always the challenge. It wasn't head count planning because quite linear. People make it out to be it's like this really complicated thing, it's not.
it's getting the appropriate and accurate levels of demand because a d demand planning is ultimately a task and uncertainty and forecasting and both of those things are I I hate to define a word with a word, but they're very uncertain.
And so knowing how to do this and in your time horizon for which you're looking to do this is quite difficult at at most organizations. And and again, this goes back to kind of that forward deployed engineer concept is you have to be quite embedded with the business to have an accurate sense of the demand plan for what is needed. Where it's gotten even more complicated is people are rightfully asking themselves the question is.
we used to hire on a kind of a one to one basis. We knew there was one unit like from like a unit economic standpoint, there was a one unit increase that we needed in human level productivity. We need to go post one role externally or promote one person or do some kind of like upskilling or training or internal mobility or whatever it takes to make that happen. And it's no longer that one unit to one unit ratio is is broken because of AI.
And and and so that's it's a really challenging question to to figure that out. And so I think actually for the first time headcount planning, the linear part of it is not so linear anymore.
Chris Mannion (16:36)
I think I I want to like dig on that and and probably at the risk of going off on a tangent as well. You mentioned the the kind of like the the the cost and how we define we we had this many discussions around is is an agent an FTE or like how do you define it, how do you budget for it? But a a few years ago we we had a conversation about quality of hire. And we'll say like your model back then was employee lifetime value.
And I think that's really interesting because from a business perspective, you have, you know, acquisition cost and service costs versus lifetime value of a customer. Look internally at an employee, I think it's really interesting. And then that's a really good way of measuring like what is the quality of our hiring pipeline and the people that we have in the organization. When you start to layer AI into that, like how do we
Have you seen any any elements where we can actually accurately measure the quality of this new hybrid structure where it's human FTE plus AI? And then how do we know if we're successful, you know, six or twelve months down the road if we've replaced I've I've heard one example of an engineering team trying to replace 80% of their new net new roles with AI. Like how do they know at that point whether that was the better use of their their spend?
Cole Napper (17:43)
Yeah, I think there's there's a lot wrapped into that question. Like my mind immediately went to like I've seen some folks that are like trying to create like psychometrically validated assessments to evaluate, you know, AI agents. And it's
Chris Mannion (17:57)
Yeah.
Cole Napper (17:57)
just like I I think we're I think we're going too far, guys. Yeah, I mean maybe
Chris Mannion (18:01)
Ha ha.
Cole Napper (18:02)
maybe there's a case there. I don't know. I I try when I think of of AI versus humans, a human it really matters, like intent matters, like what's going on in the six inches between
between your ears matters. I actually don't care as much in an AI. Like I just care about the output.
And and so if if I think about things in terms of like employee lifetime value, that's a very output laden way of looking at these things. And so for the uninitiated who aren't familiar with this concept, when a human being starts a role, they're usually at a net a net negative value add to the organization. So they're consuming resources from the organization, but they're not producing any output. And then eventually you hit kind of a break-even point, ideally as soon as possible, where you get upskilled, you get trained, you understand where
where
the restroom is and you can start to actually produce value for the organization, usually leveling off after you know 18 months, three years into role, and then you see a much more graduated you know, step function that goes up over time and then eventually starts to slide down as a person is exiting the organization as well. Do I intend to see that AI agents have a similar lifetime value curve?
Honestly, I've never thought about that question. I would imagine if an AI agent starts out as a net negative, that would be unacceptable to most firms. So you would at least need to be starting in positive territory. I can imagine a world where AI agents are are evaluated on their output and maybe with new model releases or with additional training or maybe token usage optimization or something along those lines, maybe you see kind of that step function and value creation over time.
I don't think you're gonna exit your agent from the organization and see that
Chris Mannion (19:46)
Yeah.
Cole Napper (19:47)
downwards I I so I'm not sure the metaphor really lines up one to one, but I think there are probably some some ways in which that that metaphor could still, you know, be useful in talking about how would you quantify the value of your humans versus your agents.
Eric Guidice (20:03)
Let
let me play a little I don't know if it's devil's advocate, but what's the difference between this phenomena of AI adding productivity and the SAS boom of the nineties, right? Like if I'm a person who kept track of things on a Rolodex and now I have a CRM and I can do more with that, or I'm able to do an automation or run people analytics with a script versus back of the napkin math, right? Like ha what what's the difference in AI's increase in productivity? Like why don't we see that
curve just everyone uniformly has a increase at the same level, the AI bump of productivity, and then the delta in human performance is their ability to action that AI and and guide it. What why why isn't it like that?
Cole Napper (20:46)
Yeah.
Well, first of all, it's not a terrible thought experiment to run, right? Is this time like last time? Right. And I think that's a good kind of historical notion. Anytime you're going through either what feels like a paradigm shift or is being sold as a paradigm shift and those two things are different. y it's probably good to kind of run that that that formula in your mind. I think when I when I think about how to quantify this, I go back to my training in Lean Six Sigma.
one of the things that you think about when you're doing like value stream mapping or you're trying to map out a process, not only to look for things like waste or inefficiencies or defects, but you also want to understand like batching mechanisms and where bottlenecks exist. And so just because in steps one through three in a process you've seen a you know step change again in radical productivity improvements because of your AI, if there's a bottleneck at step four, all of that is
for not, right? And so one of the things you start to realize from like an economic value gain, step four becomes the only thing that matters anymore.
Right? And if you can't automate it to the same levels as steps one through three, essentially you've created a new form of waste for the organization. Right? And and so I I think this is the problem that many organizations are running into is that they want AI to take an end to end process and to completely automate it so that steps one through ten, if there's a ten step process, everything can have a like what in the you know Toyota way would be called like a
one piece flow of everything would go through at a s at a at the same pace and you would see the same number of inputs as outputs and and you could you know time it and optimize it and all those types of things. Realistically, I I don't think I've ever seen a use case of that yet.
Of something that's end to end 100% automated, and therefore you haven't seen the massive productivity gains. And so it would be right to say that maybe this is just like SaaS, right? Until you start to see this, it's not to say that it's not possible. It's just we're still early, right? But if if this is a fundamental, unsolvable problem, that's when you start to say maybe all this AI investment is probably kind of crazy, and maybe our whole economy riding on the success of AI.
Eric Guidice (23:11)
I
think, you know, specific to headcount, right? I think the thing that I see the most, based on my purview, I'm six years into doing only headcount software with a goal of unifying data across the systems. The thing that I'm running into now with AI the most is it relates to the headcount space, is there is a foundational like it, we're we're calling it infrastructure headcount infrastructure, right? So and I think we generally agree in terms of like what this is, but it's
Teams not arguing over a headcount number or eliminating the data bottleneck for AI. And so if you don't have a platform that everyone believes is the source of truth of headcount information, then all of the automations that you build on top of it are going to be impacted. So for example, we'll run into a customer who moves over to the platform by previously connecting an AI to
MCPs of ATS, HRS, FPNA without a unified database, and therefore they have to there's a lack of productivity or a missing productivity in their workflows because the AI has to do too much guessing. It's not off of a workflow. And so when we're thinking about the productivity curve of every individual headcount, there's a certain level of infrastructure work, whether you're in design and you need a design brief, or you're in headcount, you need one source of
truth
of data or a CRM and a sales system that unify all the customers? Like, is there a foundational work that is required to extract the productivity of headcount that you're seeing play out in the people analytics space as we look at 2027 and beyond?
Cole Napper (24:55)
Yeah, I mean I I think
To like the the question you just ask seems absurd to like an analytics person. But
Chris Mannion (25:02)
Mm-hmm.
Cole Napper (25:02)
just like, you know, if you're trying to build the foundation of your house on sand in terms of not having a core source of truth, that house is gonna fall down. Right? And and so I think about this, I I believe I think it's like I'm gonna butcher it, but I think it's like a Peter Drucker quote or something along those lines that if you you know, you're trying to automate a process and and there's a fault in the the the
process itself you're not going to automate the process you're going to automate the fault and so essentially you're going to see that the error at scale not the the output at scale and so yeah you you have to create mechanisms by which you you have standardization of data core definitions sources of truth systems in which those reside ways in which you audit that to ensure that the accuracy of it and and then even getting
to like acceptable levels of error. Like one of the things that in in the headcount space that's very common, it's it's like it's almost an insolvable problem, is like backdated headcount changes.
So again, you're getting to the end of a quarter or the end of a month, and somebody on the you know 31st day of the month was gonna switch jobs to another team, and so but but it wasn't reflected in the system until five days into the next month, and then it was backdated to the thirty-first of the prior month, but everything you reported in the prior month is now wrong because of that. That's an acceptable level and and like a way that you have to tolerate that there's differences. but
But
that's not just because like you just have a completely leaky bucket of headcount information for your firm. It's because the procedures in place have to accommodate that kind of backdating that occurs.
Chris Mannion (26:46)
We we've actually started to see I think like building on that, the the recognition that that's a that's a problem inside companies and I keep seeing like talent engineer come up as a a new a new job title. I I don't think it's new, I think it's just a rebranding of what some people were doing a few years ago. Like what what what's your take on that? Do you do you think this is a kind of like a new field or like where do you think that fits into the picture?
Cole Napper (27:11)
It's just data engineering. It's always been data engineering. I mean, like most organizations couldn't afford data engineers, right? And so that was always a problem because data engineering as far as
supply and demand, there was always a lack of supply, especially with HR data. Like this is one of the things that I don't think many people understand or appreciate is as far as data goes, because there's many different functions in a business that require data. As far as data goes, HR has some of the most challenging data of any function. Like there are there might be others in certain industries or certain organizations where it's where it's more difficult, but HR data is a lot of times it's the worst and the most challenging. Therefore
that makes that the job of a data engineer the hardest. Right? So there's people, they're often not going to understand the data. There's a lack of supply of them already. There's a huge demand for it. And therefore the compensation and the wages for that type of work. And frankly it's just difficult work and so people might not just want to do it anyway.
It's a it's a hard role to fill and I think it it will probably always be a hard role to fill because th you know, it's just it the the the combination of supply and demand are not in the organization's favor.
Chris Mannion (28:21)
I have a funny story
Eric Guidice (28:21)
I think.
Chris Mannion (28:22)
on that actually. I'm when I s first started taking over some of the people analytics responsibilities, Amit Mahindra, who you also know is running the people analytics team, and I'd moved over from supply chain and he he spent a lot of time trying to explain to me why I couldn't just use the SQL query to get all the people data out of the HRIS. So it's it's a very challenging space,
especially for
Cole Napper (28:43)
Yeah, for sure.
Chris Mannion (28:44)
someone coming from the business who doesn't understand why, like me.
Cole Napper (28:48)
No, Ahmed's a great guy.
Eric Guidice (28:49)
I think I I'm gonna have a take. I don't know what the reaction will be, but playing off of what you're saying, Cole, is like if people in my experience, from when I was consulting, recruiting and headcount,
For the investment banks, before I started HeadCount 365. My experience is that the people engineering supply was the most underfunded part of a people organization. So unless you're Amazon or Microsoft or Facebook, you don't create your own internal tools. They are not the priority. They don't generate revenue, et cetera. And then I hear combining the
People data being the most complex and the hardest to work with, we now see the talent engineer being popularized as a, you know, in your words, a a rebranded data engineer. But talent engineers, at least in the bulk of like LinkedIn popularity, are recruiters moving into engineering or data engineering roles. They don't have the formal training. So we have a new wave of talent engineers or data engineers working with the hardest data set.
with the least amount of formal training. To me that sounds that sounds like
Cole Napper (29:59)
Yeah. What could go wrong?
Eric Guidice (30:01)
a a recipe for something. And I what what's your what it you know if I'm seeing a wave of talent engineers join the workforce from the recruiting space without this training, working with this data set, what's your prediction?
Cole Napper (30:14)
I don't know, chaos. But I I g I think I mean maybe that's unfair. I think some folks are assuming and and and there there could be, you know, reasonable minds could disagree about this, that with AI tools that maybe that data engineering job the barriers to entry might decrease a little bit, maybe it becomes easier. So maybe you don't need to have such a technical skill set to get into that role. It's still a hard job and still requires a lot of technical
Subject matter expertise, they're probably gonna fail.
Eric Guidice (30:42)
Should we expect to see
should we see a expect to see a Cole Napper, maybe HR bench collab on like a prompt library for town engineers or data engineers? Like, here's the guardrails you need, here's the infrastructure you need, like what
If someone is walking into this role from the talent side, they've been tasked, let's say they're the smartest person on their recruiting team, what's your what's your base level advice for somebody walking into a people data role? What's your what's the first thing you ask them to do?
Cole Napper (31:10)
I mean that realistically
You know, you you mentioned HR bench, like we do this for them, right? So that they don't like the talent engineer the so think about this as like I think this exists in in again every kind of data function is is the engineer's role to be a a data producer or a data consumer, right? and the HR bench equation is to change that talent engineer's job from being a data producer to a data consumer, they still have a role and it is a necessary
role and so it could be you know they're creating their own Snowflake or Databricks or Amazon or whatever data warehouse and then feeding that data into HR bench or they might just load it into HR bench and then rip it out and then put it into Snowflake or Databricks so that they can have you know things that are outside of our ecosystem to match it with other internal sources, probably the latter, not the former. And and the reality is that makes their job wildly easier.
Right? because you have that again, that technical subject matter expertise through a vendor in this space. The reality is if they're going to be a consumer, I mean I'm sorry, a producer, that's a much harder job, and you're really starting at step zero. And you know, y think about like writing a paper in college, right? The hardest part is when you're staring at that blank screen and there's nothing there, right? That's a hard job, right? And if you're staring at the blank screen of like we have no data.
data infrastructure now it's my job to fix that, that's a tough task.
Eric Guidice (32:41)
I think there might be you might have just lined up a headcount 365 HR Bench partnership for infrastructure
Cole Napper (32:47)
Hmm.
Eric Guidice (32:48)
and production, but we can cover that off off camera.
Cole Napper (32:52)
Sure.
Eric Guidice (32:53)
I the interesting thing about the talent engineer is the output that they're asked to produce, right? And I think what is interesting, so as as a headcount podcast, I think the listeners here are interested to know what a people analytics function produces over what a rec ops or what a generalized analytics function would produce, and how they go about doing it. Now I have a
based on my my Cole Napa research, I wanna kind of focus on the idea of thermometer versus thermostat. And because I think that to me, when I look at the work that you've done or others in the space, it's predictability. It's getting in front of it versus showing people what
Cole Napper (33:32)
Yeah.
Eric Guidice (33:32)
happened in the past.
Cole Napper (33:33)
I mean I I don't know if I'd necessarily frame it in that way in terms of like the differentiation between like rec ops and people analytics and that type of thing. I think everybody probably has their role to play. Any role that in NHR that has ops in it, I always assume even though like different people do different things at different organizations, I always assume if you have some kind of ops abbreviation in there, you're doing a lot of transactional work and you're making sure that the ships are running on time and
when fires start, your job is to put them out, right? And that's not really the job most of the time of an analytics person. I mean there are elements of that occasionally if if you know, some kind of like data feed breaks or something along those lines. But most of the time if you think about like an like an ops person is like the you know, the
you know, the warrior that's going out to like tackle the enemy. And I see like an analytics person as like the painter who's trying to paint like the Sistine Chapel and create something that's beautiful that people can consume. And and I really think that th those are fundamentally different jobs. In terms of like being a a thermometer versus a thermostat, realistically
And and this is easier to say and harder to do. but the realistically, most people kinda like what what does a a a thermometer do? It measures the temperature of the room, the temperature goes up, you know, the the little red thing goes up, I don't know, like the mercury inside, I think it's mercury. or in like the temperature goes down, it goes down. And really what you wanna be as an organization is you wanna be setting the pace. That's the thermostat. The thermostat says it's seventy two degrees in the room. If it gets too hot out.
we're gonna turn on the air conditioner. If gets too cold outside, we're gonna turn on the heater, but we're staying at 72 by God over our dead body. Right? And so you're gonna set the pace for here's the type of information that is relevant, how you're influencing those decisions and how the data is used by being that thermostat.
Eric Guidice (35:28)
I think what's interesting is that you've brought up some some thermostat level concepts, right? When you talk about the I I don't know if you've branded it the people maturity curve, right? From negative to there
Cole Napper (35:41)
People intelligence maturity curve, yeah.
Eric Guidice (35:44)
you go, people intelligence maturity curve. But the idea the people intelligence maturity curve shows you theoretically.
When towards the end of someone's tenure and their investment starts to decline, that there's potentially you're ready for attrition, you're ready for that backfill, you're ready for some sort of shakeup. I used to build this, this isn't
People analytics by any means, but we used to run an inside sales cycle at one of my old startups where it was relatively predictable that over the course of 18 months they'd navigate their way through the different pay structures and then eventually get to the top one where they would have a six to twelve month runway before we needed to replace that inside seller. And it was a way for us to proactively open backfills so that we didn't have the dip in revenue when we had the outgoing employee. And it's relatively simple.
I'm using air quotes for just listeners when it's one position with one comp curve with you know hundreds of people in seat to then take that information. But you know, how as we get better with the AI systems, with building better data infrastructure, how can we take the people intelligence maturity curve and start to use it to drive predictive outcomes for a business?
Cole Napper (36:57)
Yeah, th I think the the people intelligence maturity curve, it is how to set up the right foundations to be able to scale to solve any type of problem, right? And so again, it's really hard if you're if you're in the thought leadership space to put out research or models or frameworks that apply to everyone. It's just really difficult to do because there's so many edge cases. And so what it's meant to do is to be the least common denominator of like, if you want to do this and you wanna do it well and regardless of your size, regardless of your industry.
Here's what you need. What you just described about inside sales is a very specific problem, and I think it's really relevant here, which is this idea of a lot of analytics, and I mean a lot, like almost all of analytics, is only useful in multi incumbent high turnover roles. Right? If you have a steady state.
organization and let's say you have, you know, I I get asked this question a lot, and maybe we can wrap here because I do have kind of a hard out that I need to get out of here.
If you have an organization that has 500 people and there's 499 roles, or if you have another organization that has 500 people but there's five roles and one of those roles has like 400 people in it, chances are people analytics is more effective at that second organization than it is at the first. Because if you have no multi-incumbent roles and everything, there's four hundred and ninety-nine of them.
Only one role has two people in it, every other role has one person in it. There's not a whole lot of statistics that you can do to add value to the organization. A lot of the the value of analytics comes from having that variability in a multi-incumbent type of role, like inside sales. And so you're able to build out these predictive models that allow you again to predictively open a rec so that it overlaps so that when a person is sunsetting, another person's being trained up and you don't see this huge dip in productivity, but you can't do
Eric Guidice (38:50)
Chris, any closing thoughts before we let Cole plug his latest speeches, appearances, or any new content?
Chris Mannion (38:59)
no, I I I I have a a bunch of thoughts that would introduce a bunch of new concepts. so I'm not gonna I'm not gonna go down that rabbit hole, but it was fascinating. I don't really like the the total production system like lean angle that we've got here. It's hopefully giving a bit of credibility to what I've been saying for the for the last few months.
Cole Napper (39:14)
Yeah. Well Chris has been great knowing you ever since that impact work tech stuff that we did with George back in the day and I think even knew you before then and Eric thanks for having me on here. But yeah, you can always check out what I'm doing at Directionally Correct or Cole Napper dot com and and come and kick the tires on some of the things that we're doing at HR Bench. I think we're doing some pretty innovative stuff. So thank you guys again for having me today.
Chris Mannion (39:35)
Thanks, Cole. Appreciate it.
Eric Guidice (39:35)
Excellent.
Thanks Cole for joining. Chris, let's let Cole get out of here and you and I can catch up on the the last of the pod.
Chris Mannion (39:43)
Sounds great?
Eric Guidice (39:45)
All right. Cole Napper, everybody, joining us from HR Bench, Cole Knapper.com and the Directionally Correct Podcast and Substack. Longtime reader. Yeah, I had a bunch of references up. You know, I was ready to get in on the different spaces, but I'm glad that we got to what we got to in the podcast. What's your what's your biggest takeaway? What what did he I know I could see the wheels turning, so tell me what what was on your radar the most.
Chris Mannion (40:10)
Yeah, I think it's really interesting thinking about how the AI and capacity question keeps coming up and how that's gonna change, you know, how we think about kind of planning. I think his point about the value of analytics is only when you actually have
like data that is is valuable. And that's only when you have kind of large population sizes that look the same. and I wonder how much AI is going to change that. If you have a known capability within AI and you can then predict more accurately using that how much additional capacity you're going to get. And you know that that's not going to be capacity that's going to give two weeks notice at a random point in time. Like how that's actually going to play into long-term headcount planning and workforce planning. I think this I I probably have more
questions and answers coming out of that podcast. But I think that's hopefully teeing us up for some really good content in future episodes.
Eric Guidice (41:00)
Yeah, we're getting ready to do kind of like a three the second of a three-part series on, you know, town engineering and the measuring of headcount performance with AI in the mix. I think it's just such an inf interesting conversation about how how to do it, what what to measure and and why to measure it. I have a all I already have a side that I land on, but I like hearing the other perspectives. Like to me, until an AI agent.
Is like a th it we we're all threatened because of how sentient they are. I just don't think that they're anything more than you know a next to SAS or next to something else on your PL. mostly because of my own experience of like we use a lot of AI at HeadCon 365. We build code with it, it helps with content, design, etc. and the two main things that stick out to me is the way that we use
Use tokens is much more efficient than others in my newsfeed. So I'll hear people be like, I use you know 80k worth of tokens this quarter and it's
a similar size staff is my team. I I don't understand. So it's like, how are you doing that? And what principles from an engineering perspective are you employing AI? and then secondly, it's they have helped us kind of get more efficient, but it's I I look at my headcount spend as dynamic where my tokens are a little bit more predictable. They're a little bit more static. It's not difficult. I'm not getting hit with crazy bills that are are, you know
Unpredictable. So I'm just very curious in that in that side of the business. And I'm very interested to hear how it then gets applied in large businesses today to the decision-making process, to the operational process. So that was kind of like my biggest takeaway. but that's like the new that's the new fun stuff. I have some other things that are, I think, problems people are facing every single day that are very interesting, like
How do I w when do I open a headcount to get the ramp time so that they produce when I need them to produce rather than opening it when I produce? Or I am going to sell somebody. I have 10 deals in the pipeline and each of them are at a certain percentage of to close.
How many people do I hire? There's like, you know, some basic stuff. I don't think we've solved it yet to go move on to the next problem where it's like, they're a whole other person making decisions in my work chart. But that's, you know, maybe I don't see the future as much, but I'm just skeptical on how fast we'll get there and whether or not this bubble, you know, will last long enough for us to achieve it in the current, you know, financial environment. So I don't know. Those are my that's my that's my take all in one.
I have some content reactions for you though. You know, I
Chris Mannion (43:38)
Do
Eric Guidice (43:39)
still I prep prepped two that I did want to talk about. They're generally let's call them time sensitive. So let's see here. The first, let's go window. The first is from Mark Efron from Talent Strategy Group. He releases this article, this HR operating model article, about
the state of HR. And what he's claiming, or at least what he says, is that HR is shrinking. I think this goes in line with some of the things I've heard in Cole's podcast, but the we should expect to see fewer people. We should expect to see
more productivity and we should expect to see work distributed differently across HR and the COEs that employ them. what's your take? I know this is a big one. A lot to consume.
Chris Mannion (44:31)
Yeah, and it
kind of feeds into one of the questions I was asking Cole, specifically with people analytics, you know, as as you kind of cut funding and cut budgets for non-revenue generating teams, at what point do you recognize when you've you've cut to the bone and are actually starting to see kind of issues and then you actually kind of spike back up? I I think if you look at any kind of role over time, you just see this sine wave of demand.
And it it wouldn't wouldn't surprise me to see we're at a trough in demand for HR roles right now. I think there's optimism around what AI can do, but I think there's a domain expertise as well, aside from the kind of legal and governance requirements. And I just wonder to to what extent are we going to start to see that kind of shift over time. I think there was a a chart that maybe we looked at last week about the kind of rise in in TA job postings and you staff your TA
team ahead of hiring the rest of your organization, which then means that you need additional HR if you're looking at a specific ratio of FTE to HR representative. So I I think it just comes in comes in waves as you know a trigger and response. And I I I don't know if it would make any long term implications yet, even though I am very bullish on the ability of AI to actually increase capacity of each individual.
Eric Guidice (45:51)
I personally it's done wonders for some of the work that I'm doing, but it's all still managed and it's no different than a spreadsheet for me. It's a spreadsheet that does things that I couldn't do on paper and it makes it much easier to do work. Same with AI. It's not you know, it's still
It's still a we'll call junior employee. It's somebody at the beginning of their career curve as it relates to like output and production. Some of the thinking, it's very advanced, I'll take that. But I think HR, it's very interesting to see how one report says HR is shrinking, this other state of the market says recruiting is growing.
I wonder after all the big buildup is is done, this like kind of AI infrastructure buildup that is what everyone's calling a bubble. Once that's behind us and we're kind of living in what is normalized, how does that all shake out? next article. We have Josh, Joshua Sille.
Joshua Sille says McKinsey released its new its newest global survey about the state of AI in 2026. yeah, he's from Workday, he's a TA partner there. I like his content. Follow him if you're not doing so already. But there's a couple of key takeaways on top of a much larger report. The main takeaway here that was that I reacted to was the cost versus.
production and what it's doing for individual teams. I don't know if you have a specific takeaway, but any thoughts on McKinsey's state of AI report?
Chris Mannion (47:26)
I think it's just as as expected, right? We're we're at the kind of early stage where I think we're still trying to figure out where we're actually gonna see the most benefits from this. I think for organizations have said we're cutting headcount because we're investing in AI, they actually have to invest in AI, and then we're actually gonna see the results of like is that investment actually paying off? so I I think it's gonna be interesting to see how that's gonna gonna play out over the next next six to twelve months. but yeah, no
No real surprises there. I think one of the kind of interesting avenues is we're looking at to what extent can it supplement existing workflows. And one of the recent MIT re papers showed that about 40% of actual tasks that people do is not recorded anywhere. And so if you don't have the data to say what what it is that you're replacing, and then you don't replace it, like when is that actually gonna
come to pass that you you're actually going to see the the the kind of issue there. So I think it's a really interesting space. I'm not surprised that we're seeing more adoption of agentic workflows, especially as more and more companies are branding what they're doing as agentic. but I think you know we'll we'll we'll see in the next six to twelve months how those pay off and whether we'll see a reversal in that.
Eric Guidice (48:46)
Yeah, every time I there's a new disruptor, at least the pattern I recognize is the career history I have.
Taxi industry, you create something that's disruptive to shift the behavior from one platform to the next. And then as adoption becomes a little monopolistic, then you raise prices there. And now it's you know, taking a cab and taking an Uber are priced a lot more similarly than when we first started. And so in the AI space, a lot of these articles are written, there'll be a decline in the workforce, there's etc. etc.
That may be true. I think there's a lot of consulting I do with AI where I might have tried to pay a professional if I'm trying to do like blanket research or get a design inspiration or create something there I'm not the expert in it. however it costs me nothing now because is it subsidized? You know, based on the
Valuations, the public valuations and the multiples that it seems like they have some revenue to make up. So raising prices is kind of the only way to do that. And then it becomes a little bit more of a balance of like, do I hire the AI or do I hire a person? And how do I balance that? And so all these reports that are coming out now are the same thing that we did at Uber when it was like, guess what? You'll never need a car again. You could just you could Uber everywhere, it's three dollars a ride. so I just don't I'm skeptical of all the early research because of
Life experience, not saying that it's incorrect research or anything, it's just one of those things where it's like it's based on the information that we're currently presented with. So TBD, I'm always interested in reports like this because they kind of help shape my worldview. But as far as how I'm applying them to my day-to-day, I still think in order for people to be successful.
AI or human, you need to all be operating off the same data set and that you need to track the history of things in order to understand what the future of those things have changed. and so there's just basic the fundamentals, right? No matter how advanced the calculator, I still need to know the arithmetic. So that's kind of, you know, my my view. what's your what's your
Rest of your year we're headed into Halloween holiday season. You have any engagements or in-persons you're doing, anything that you got going on?
Chris Mannion (50:58)
Yeah, this week I'm I'm at MIT for two separate events at the research and development conference, which kicked off today, but tomorrow they have a deep dive on on kind of work and workforce and what's coming in the future. So very curious to see what happens there. Thursday I'm at a CFO summit as a non-finance person just to hear how people are talking about.
AI and and how it impacts their workforce planning, what their boards are saying. so some big companies represented their kind of t close links to MIT. So I I'm very curious to see the kind of the the long term view and implications of that. and then mostly quiet over the the holiday period, I think.
Eric Guidice (51:36)
Wonderful. Well, I have some big product launches coming out. We're gonna go big in 2027, so stay tuned. We'll be teasing some throughout the holidays, but excited to get to finish out the rest of the season of Headcount Experts for this year. and then stay tuned for 2027. Happy holidays if you don't tune in until the next one. but stay tuned for the next episode of the Headcount Experts.
This Podcast treats headcount as a dataset, not a report. It is a companion to our Headcount Experts conversation with Cole Napper, author of People Analytics and host of Directionally Correct. You will get a data model for headcount, his view on what AI changes, and a method for timing backfills.
What is people analytics?
People analytics is the practice of using data about a company's workforce and hiring to answer business questions: how many people the company needs, what they will cost, where hiring stalls and which plans are at risk. It differs from HR reporting in one way. Reporting describes what happened; analytics explains why and forecasts what comes next.
The discipline sits between HR, finance and recruiting. Each of those functions owns part of the data, and none of them owns the whole picture. That is why the first deliverable of most people analytics teams is not a model. It is a reconciled count.
From thermometer to thermostat
Cole Napper frames it like this: A thermometer reports the temperature. A thermostat sets it and acts to hold it. "The thermostat says it's 72 degrees in the room. If it gets too hot out, we're gonna turn on the air conditioner. If it gets too cold outside, we're gonna turn on the heater, but we're staying at 72."
A thermometer function reports headcount, hires and departures after the fact.
A thermostat function sets the target, usually the approved hiring plan, and flags when reality drifts from it: a start date slipping, an offer landing above budget, a seat about to go empty.
A thermostat still needs an accurate thermometer. If the count of positions is wrong, the function acts on the wrong signal. That is why Cole's "people intelligence maturity curve" starts with foundations rather than with models: in his words, it is about "how to set up the right foundations to be able to scale to solve any type of problem."
Where analytics adds the most value
Analytics pays off where there is enough repetition to learn from. Cole puts it bluntly: "Almost all of analytics is only useful in multi-incumbent, high-turnover roles." A company of 500 people in 499 different roles gives a model little to work with. A company of 500 people where 400 share one role, such as inside sales or customer support, gives it plenty.
What people analytics is not
It is not a dashboard tool, and it is not a survey program. Dashboards are an output. Engagement surveys are one input. The work is defining the entities, keeping them consistent over time and turning changes in them into decisions a business leader can act on.
Why is headcount data the foundation of people analytics?
Headcount data is the foundation because almost every people analytics question is a question about positions over time: how many, at what cost, filled when. If the count of positions is wrong, or if it only records the current state, every metric built on top inherits the error. A good headcount dataset records the plan, the forecast and the outcome separately.
Count positions, not just people
An HRIS counts employees. A plan counts positions, including ones nobody holds yet. People analytics needs both, joined. The useful unit is the position: a seat the company has decided to fund, which may be filled, open, being recruited for or closed.
Three position types cover most cases:
New hire: a seat that did not exist before.
Backfill: a seat vacated by a departure and funded again, linked to the person who left.
Vacant seat: a departure with no backfill yet. It is still part of the funded organization until someone decides to close it.
The last one is where many models undercount. If a departure simply drops out of the count, the company's committed cost looks lower than it is.
The people in those positions are not all W-2 employees either. "I wouldn't necessarily say headcount is payroll," Cole says. "Payroll is a component of it." He thinks in full-time equivalents: full-time and part-time staff, contractors, contingent workers, consultants and, increasingly, AI agents tied to a workflow with money flowing to them. A position-level dataset can hold all of these, as long as each one is tied to the funded seat it fills.
Keep plan, forecast and actual values apart
A position's title, level, salary and start date change between the day it is budgeted and the day someone starts. Overwriting those values destroys the most useful signal in the dataset: how far reality drifted from the plan. Store them as separate families instead.
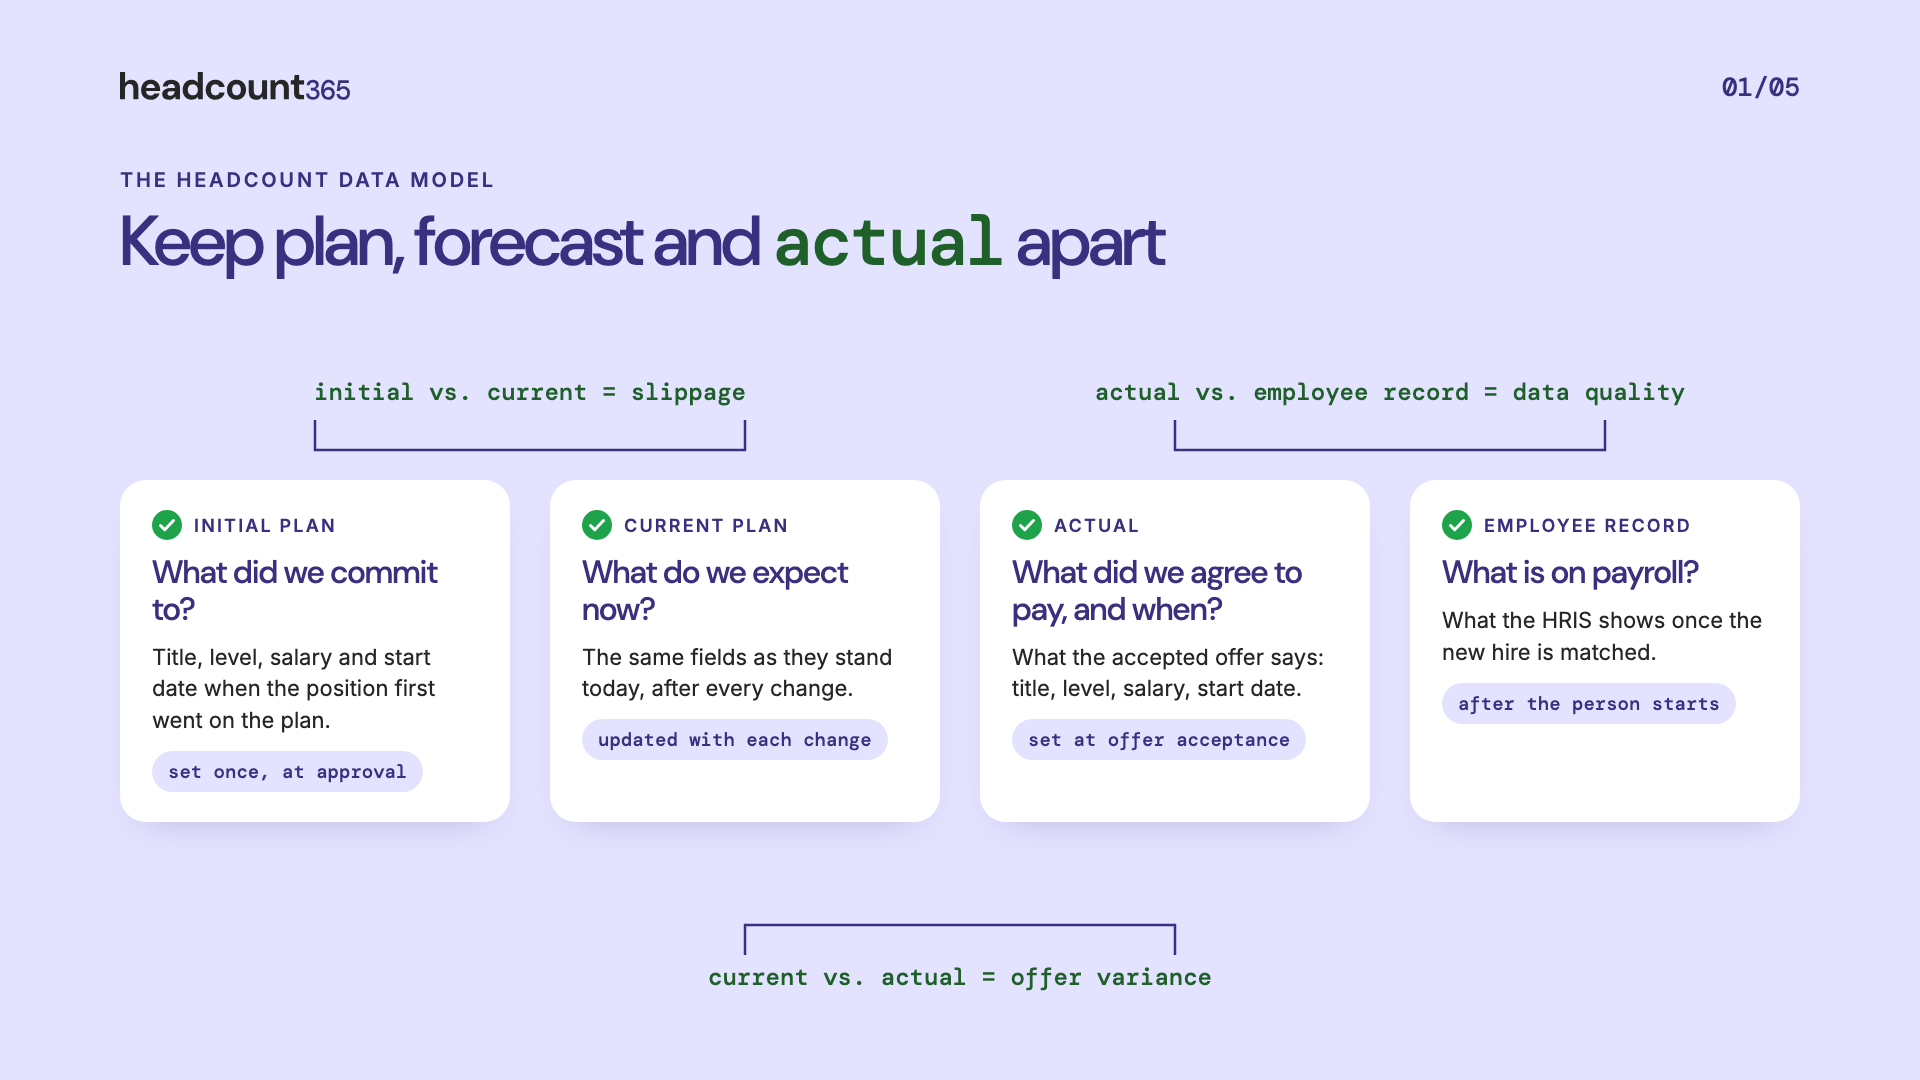
Each position carries four versions of the truth: the initial plan, the current plan, the accepted offer and the HRIS record. Cole Napper explains why analytics built without one source of truth "is gonna fall down" at 24:55
Initial plan against current plan measures slippage. Current plan against actual measures offer variance. Actual against the employee record catches data quality issues between recruiting and HR systems.
Track the state of each position
A position moves through a lifecycle: drafted, pending approval, approved, open for recruiting, posted publicly, offer pending, offer accepted, filled. It can also be rejected, put on hold or removed from the plan. Recording when each transition happened turns a static count into a time series. That is what makes time-to-approve and time-to-fill measurable without a manual tracker.
What happens when the foundation is missing
To an analyst, the need for one source of truth sounds obvious. Cole agrees: "If you're trying to build the foundation of your house on sand, in terms of not having a core source of truth, that house is gonna fall down." Automation makes the problem worse, not better. If the process has a fault, "you're not going to automate the process, you're going to automate the fault."
He lists what a sound foundation needs: standardized data, core definitions, a system where the source of truth lives, a way to audit it, and an agreed tolerance for error. Backdated changes are the classic example. Someone moves teams on the last day of the month, the change is entered five days later and backdated, and last month's report is now wrong. That is tolerable when the procedure expects it. It is not tolerable when it is a symptom of "a completely leaky bucket of headcount information."
HR data makes this harder than in most functions. "As far as data goes, HR has some of the most challenging data of any function," Cole says. It is spread across the HRIS, the ATS and finance tools, and it changes every time someone is hired, moves or leaves.
How is AI changing headcount planning?
AI is breaking the assumption that one unit of extra work means one more hire. Headcount planning used to be fairly linear once demand was known. Now each new need may be met by a person, an AI agent or both, so the plan has to track cost and output across people and agents, starting from an accurate count of people.
The hard part was always demand
"I've always thought that headcount planning was a quite linear process as long as you had a good demand function," Cole says. The difficult part is forecasting demand, which requires being embedded with the business. He compares good people analytics teams to forward-deployed engineers: they sit with finance, sales, operations and R&D, not behind a laptop.
The one-to-one ratio is broken
Companies used to hire on a one-to-one basis: one unit of extra work, one more role, posted, promoted or trained. "That one unit to one unit ratio is broken because of AI," Cole says, "and so I think actually for the first time headcount planning, the linear part of it is not so linear anymore." Planning now means weighing what he calls tokenomics, the spend on AI usage, against the spend on headcount.
A bottleneck caps the gain
Cole draws on Lean Six Sigma to explain why AI gains often fail to show up. If AI speeds up steps one to three of a process but step four is still manual, "step four becomes the only thing that matters anymore." He has not yet seen a process automated end to end. Until that happens, the human positions around the bottleneck still set the pace, and the headcount plan still decides the outcome.
What this means for headcount data
Every comparison between people and AI needs a human baseline: what the positions cost, when they start and what they produce. Without an accurate headcount plan, there is nothing to compare AI spend against. [DATA NEEDED: a credible survey figure on how many companies track AI spend alongside headcount spend, with source.]
Worked example: measuring plan drift in an engineering hiring plan
Plan drift is the gap between the hiring plan a company approved and the one it is executing. Measuring it takes three numbers per position: the initial plan value, the current plan value and the actual value. The example below uses a hypothetical company to show the method; the figures are illustrative, not benchmarks.
The setup
A software company approves 40 new engineering positions for its plan year, each budgeted at $160,000 base salary. Six months in:
12 open positions have had their expected start dates pushed back by an average of 60 days.
18 positions have accepted offers. Their combined actual base salary is $2,995,200.
Of those 18, the salary was changed on 7 positions. Two changes were made before recruiting started; five were made while the offer was being finalized.
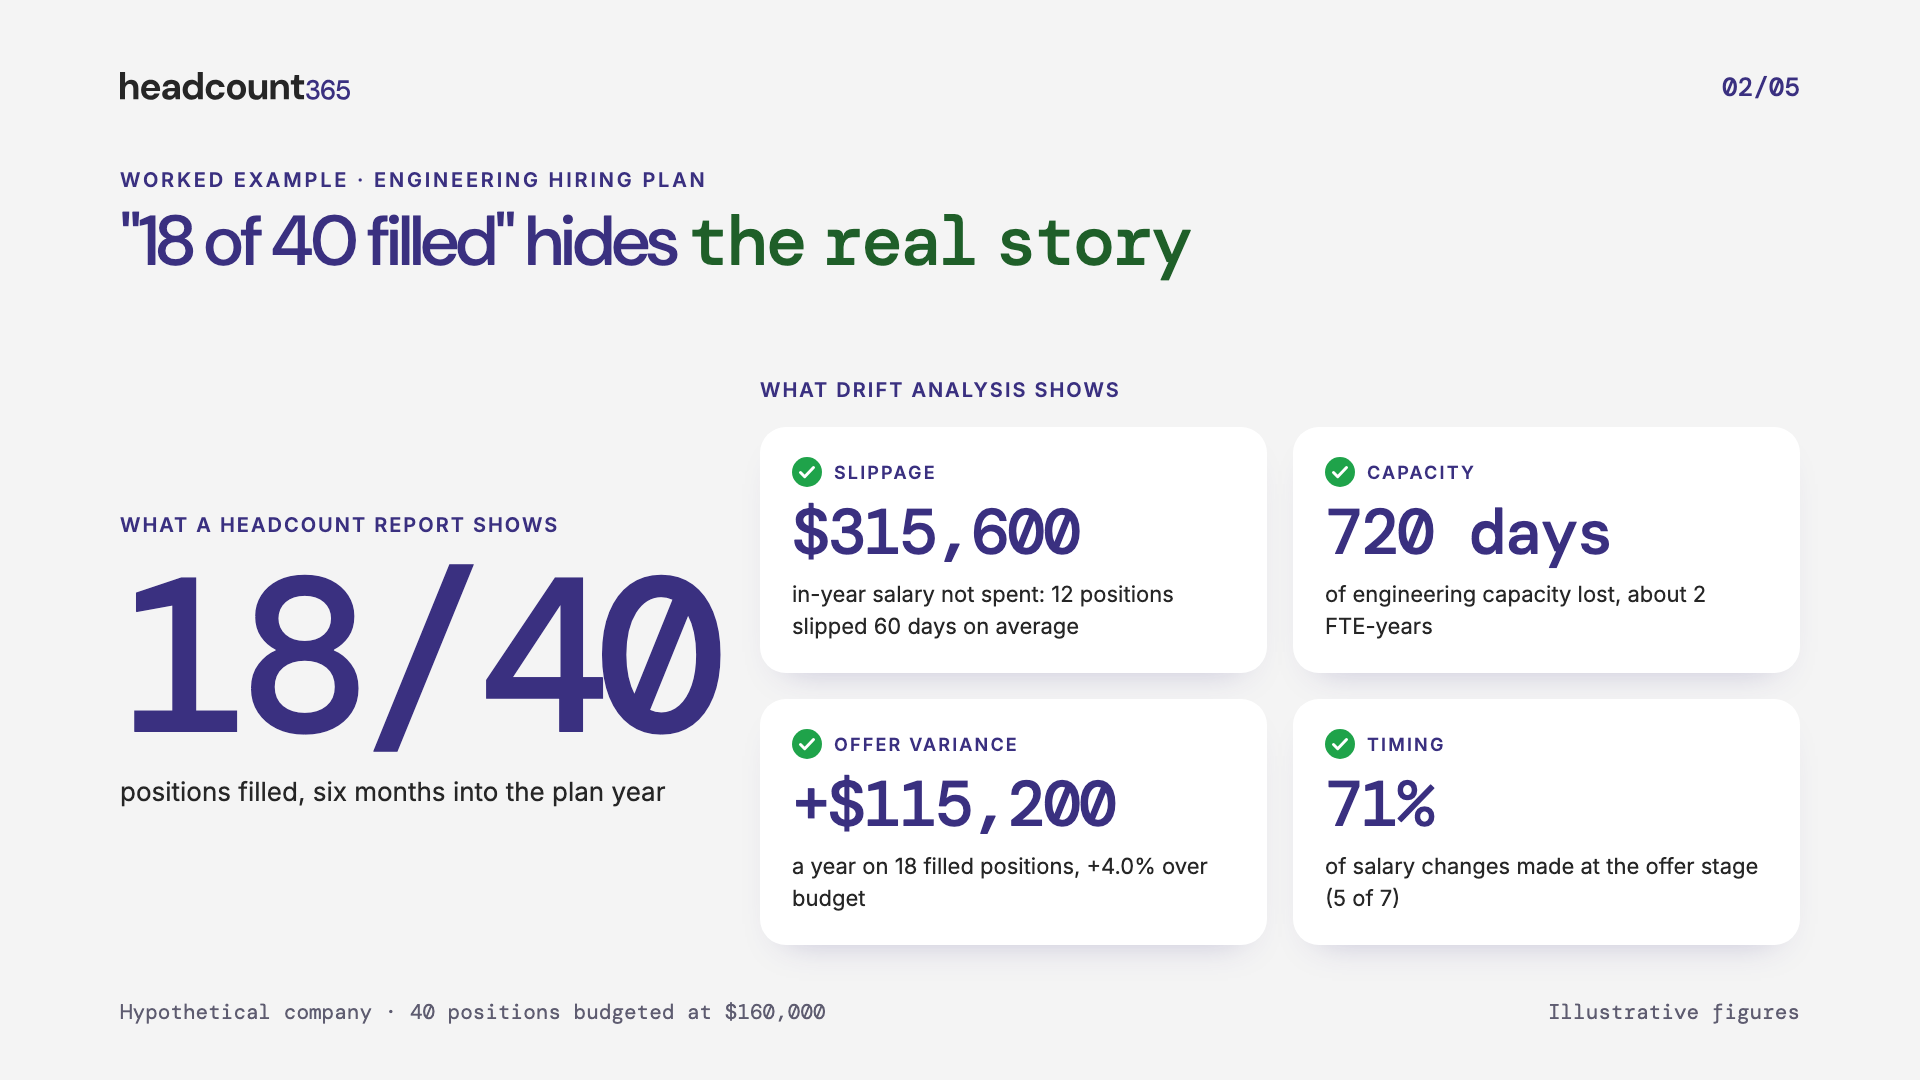
A report that says 18 of 40 roles are filled hides $315,600 of unspent salary and 720 days of lost capacity. Hear the hosts and Cole on how headcount relates to the hiring plan at 13:07
What it tells the business
A headcount report would show 18 of 40 positions filled. The drift analysis tells a different story. Finance will see an underspend this year, but engineering is short roughly two engineers' worth of capacity, which is a delivery risk, not a saving. Meanwhile, the positions that did fill will cost $115,200 a year more than budgeted, and that cost carries into every future year.
The timing of the salary changes is the diagnostic. Changes made before recruiting point to a planning problem: the budgeted rates were stale. Changes made at the offer stage point to the market: candidates are closing above band. Those call for different fixes, and only a dataset that records when each change happened can tell them apart.
Edge cases to handle
Multiple currencies. Compare salaries within one currency, or convert at a recorded rate. Never sum amounts in different currencies as they stand.
Positions on hold. A paused position is still in the plan and the budget. Exclude it from time-to-fill, but keep it in planned headcount.
Removed positions. A position taken off the plan is not a hire and not a vacancy. Keep it in the history so the original plan can still be reconstructed.
When should you open a backfill?
Open a backfill early enough that the replacement is ramped before the current employee leaves. In practice, that means working back from the expected departure by the time to fill plus the time to ramp. It works best in roles with many people doing the same job, where departures are frequent enough to predict.
The employee lifetime value curve
Cole describes the value of an employee over their tenure as a curve. "When a human being starts a role, they're usually at a net negative value add to the organization," consuming resources before producing output. They reach break-even, usually level off somewhere between 18 months and three years in role, climb in steps with growth and promotion, and "eventually [the curve] starts to slide down as a person is exiting the organization."
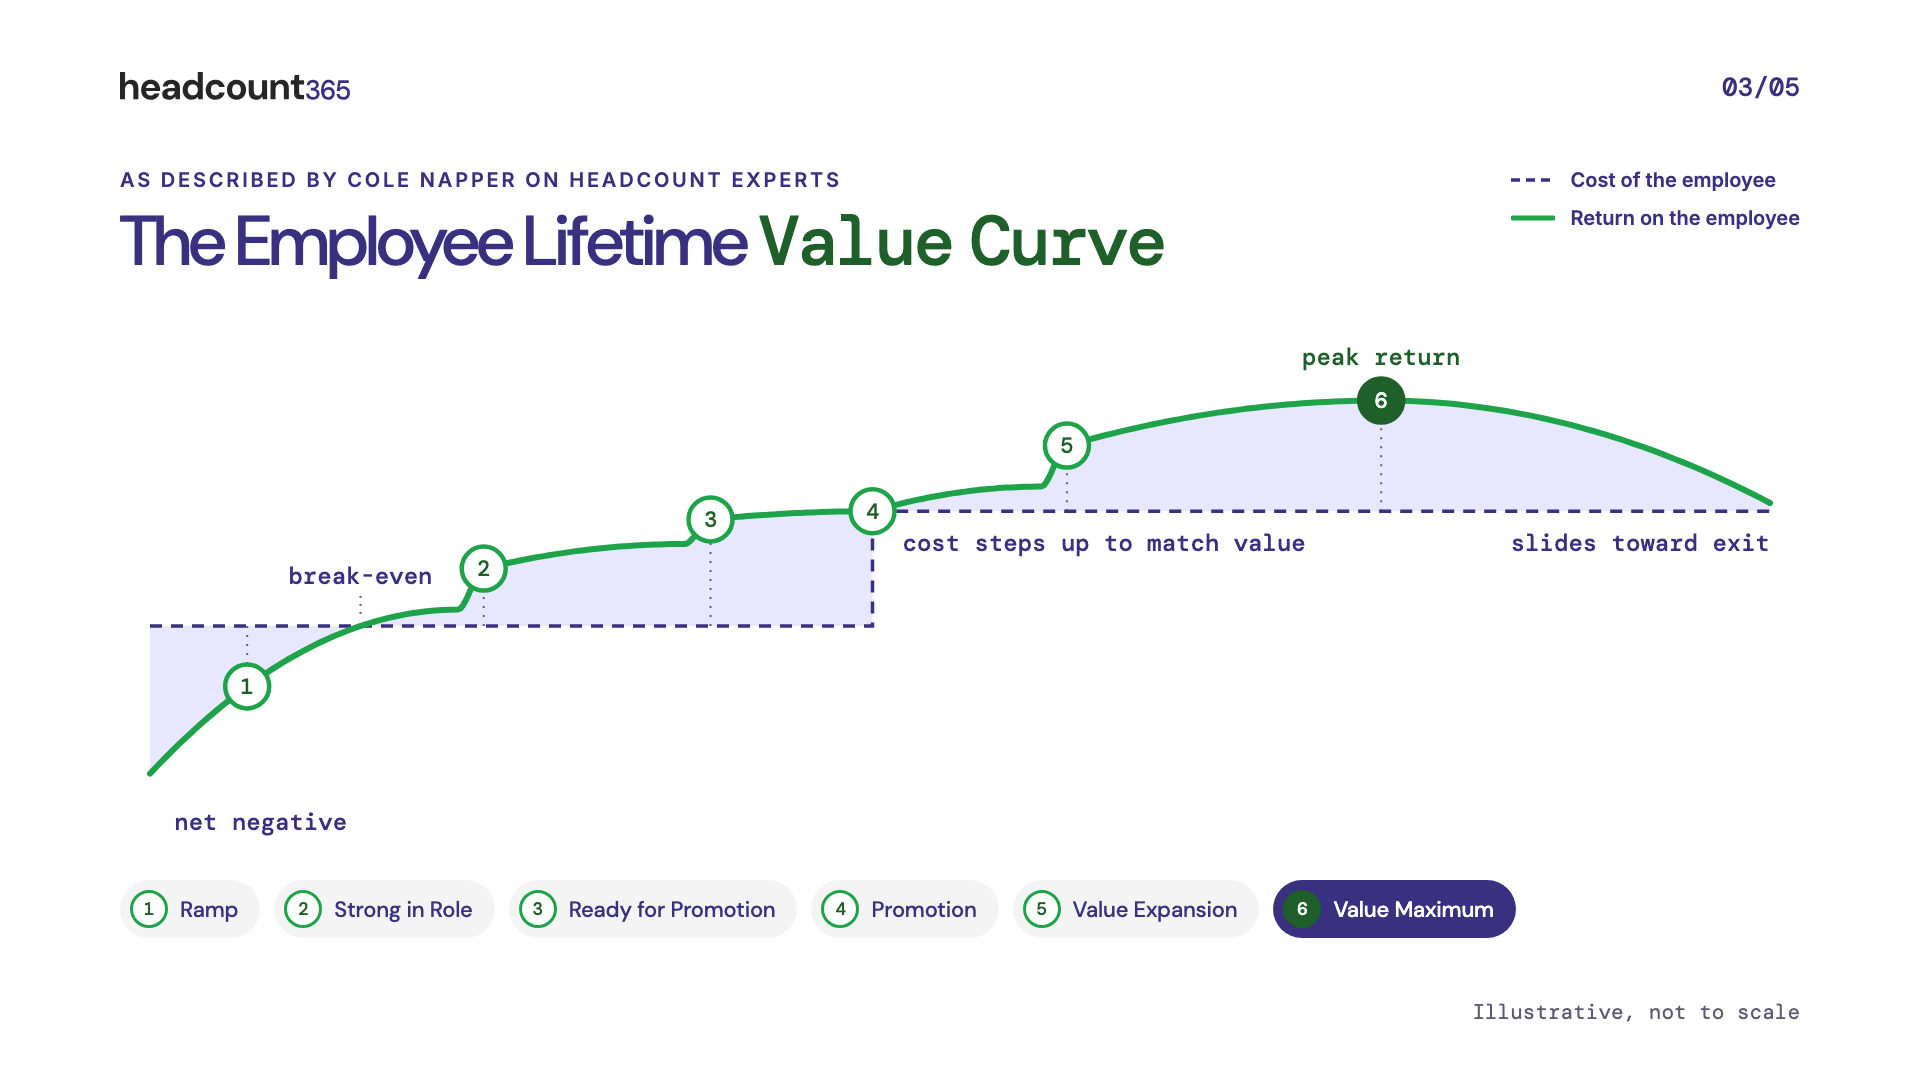
New hires start below break-even, level off between 18 months and three years, and decline toward exit. Cole walks through the curve at 17:43
Two ways to backfill the same seat
Backfill at the exit. The requisition opens when the employee resigns. The seat produces nothing through recruiting, then the replacement starts the curve again from below cost.
Backfill at peak return. The requisition opens when the employee reaches peak value. The replacement is already ramping when the employee leaves. There is a short overlap with two salaries, and the seat never goes dark.
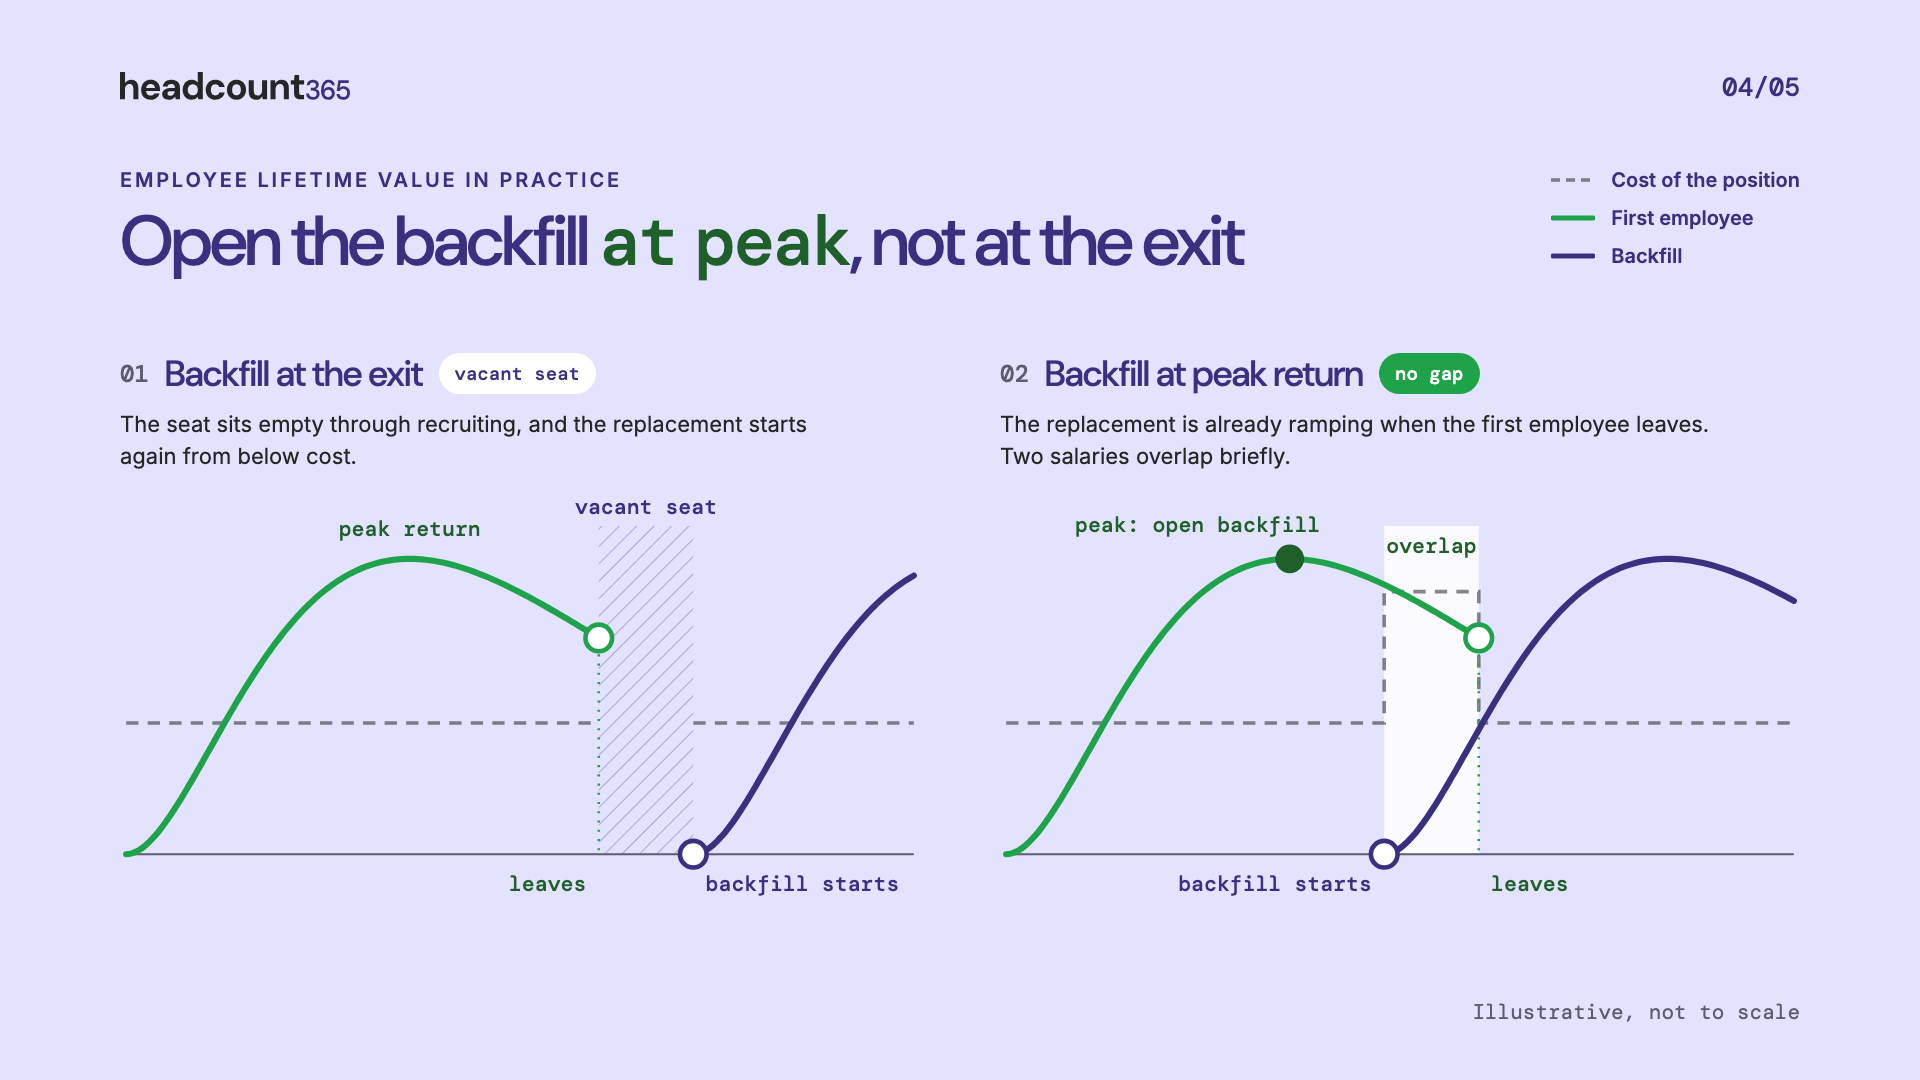
Backfilling at the exit leaves a vacant seat; backfilling at peak return leaves no gap. Cole on opening requisitions early so they overlap, at 36:57
A worked example: inside sales
On the episode, headcount365 founder Eric Guidice described an inside sales team where reps moved through the pay tiers over about 18 months, then typically had six to twelve months before they left. Using illustrative numbers for the rest:
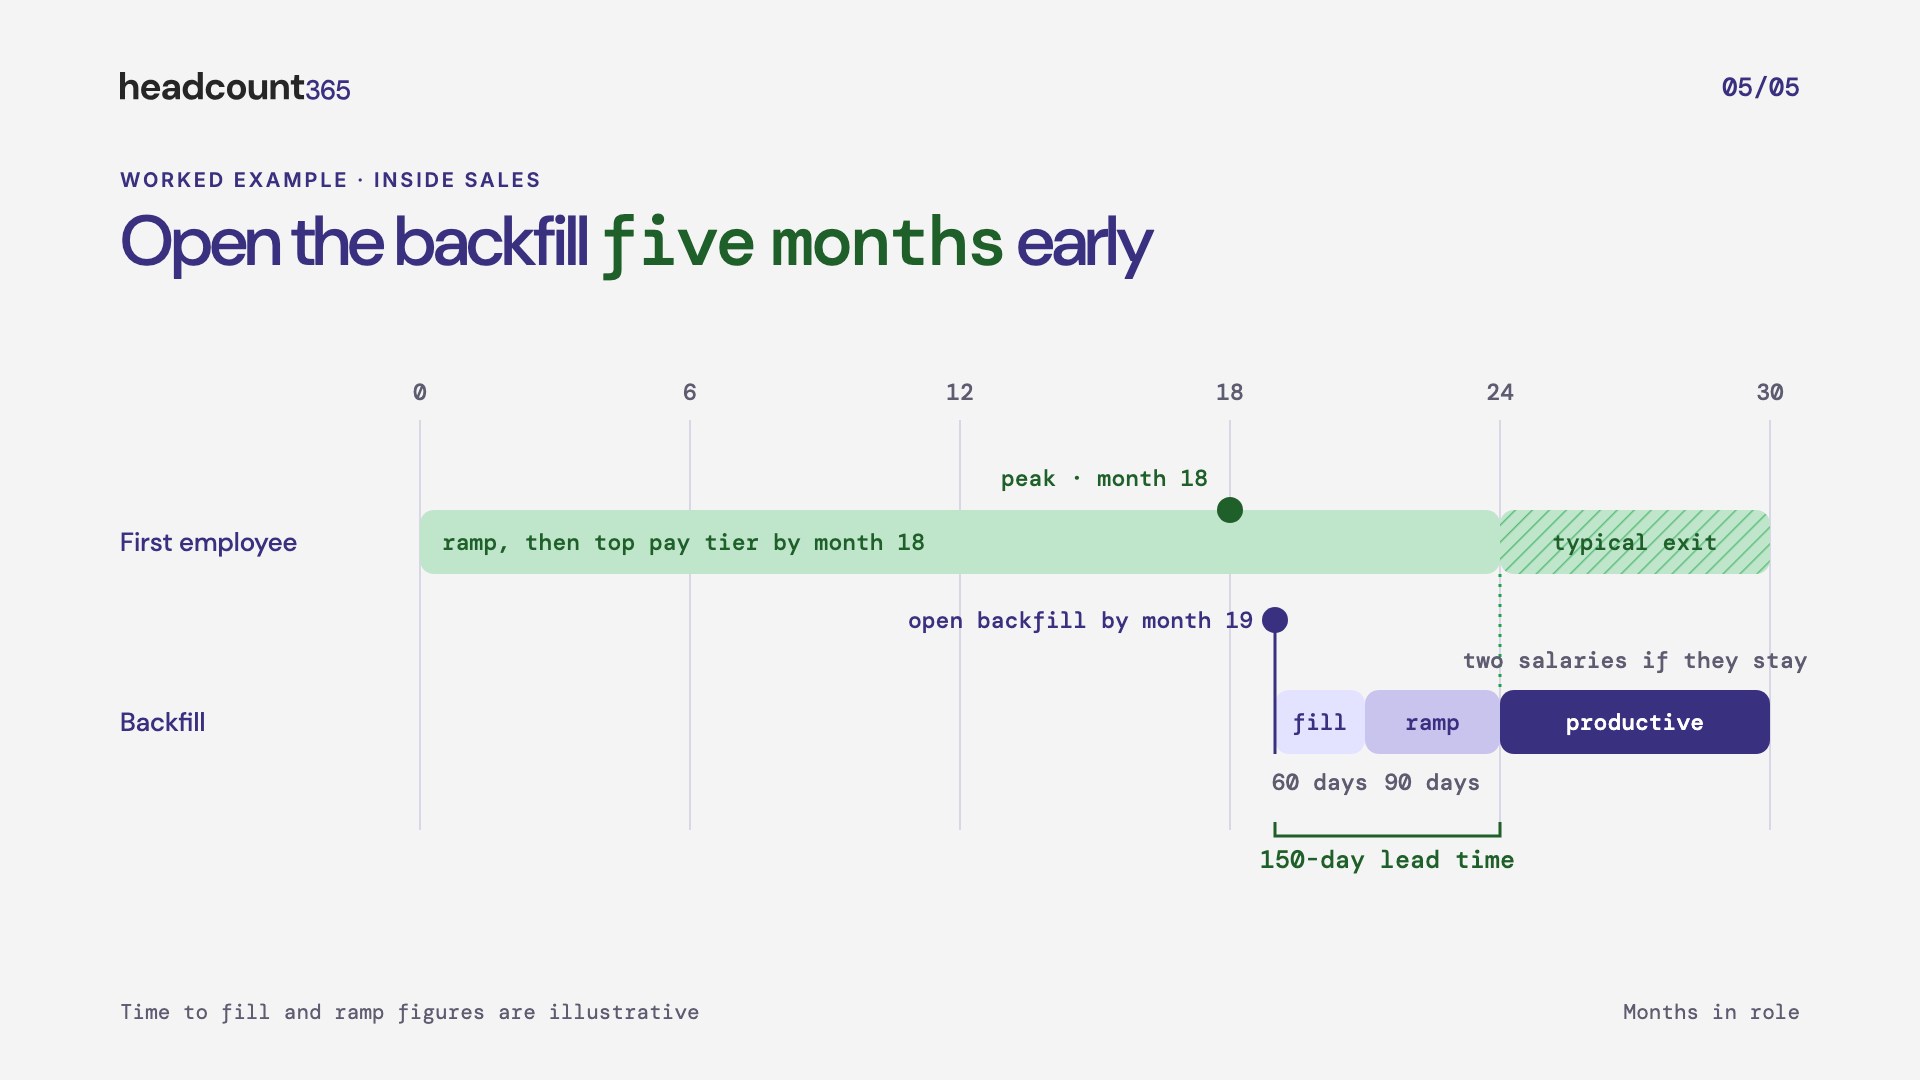
Eric's inside sales example starts at 35:28
Opening at month 19 means the replacement breaks even by month 24. Opening at the resignation means about five months of lost or reduced output for every departure.
The overlap has a cost. If the employee stays until month 30, the company pays two salaries for longer than planned. This is why the method works best in multi-incumbent roles. On a team of 40 reps, you don't time each backfill to one person. You forecast how many reps will leave each quarter from past turnover, and keep that many requisitions open five months ahead. Cole's description of the same approach: predictive models "that allow you to predictively open a rec so that it overlaps, so that when a person is sunsetting, another person's being trained up and you don't see this huge dip in productivity."
When not to use it
Single-incumbent roles. With one person in a role, there is no history to predict from. Plan succession instead.
Roles with long notice periods. Where notice runs three months or more, the notice period itself covers part of the lead time.
Positions being redesigned. If AI or a reorganization may change the role, decide that before reopening it.
Should a people analytics team build its own headcount data pipeline?
A capable people analytics team can build a headcount data pipeline. The harder question is whether it should own the system of record that creates the data. Analysis can live anywhere. The plan, its approvals and its change history have to be captured at the moment decisions are made, or they are lost.
That distinction matters. Most in-house headcount models are reconstructed after the fact from spreadsheets, ATS exports and HRIS snapshots. They can show where the plan is now. They usually cannot show what the plan was in March, who changed a salary, or at which stage of hiring it changed. No amount of modeling recovers history that was never recorded.
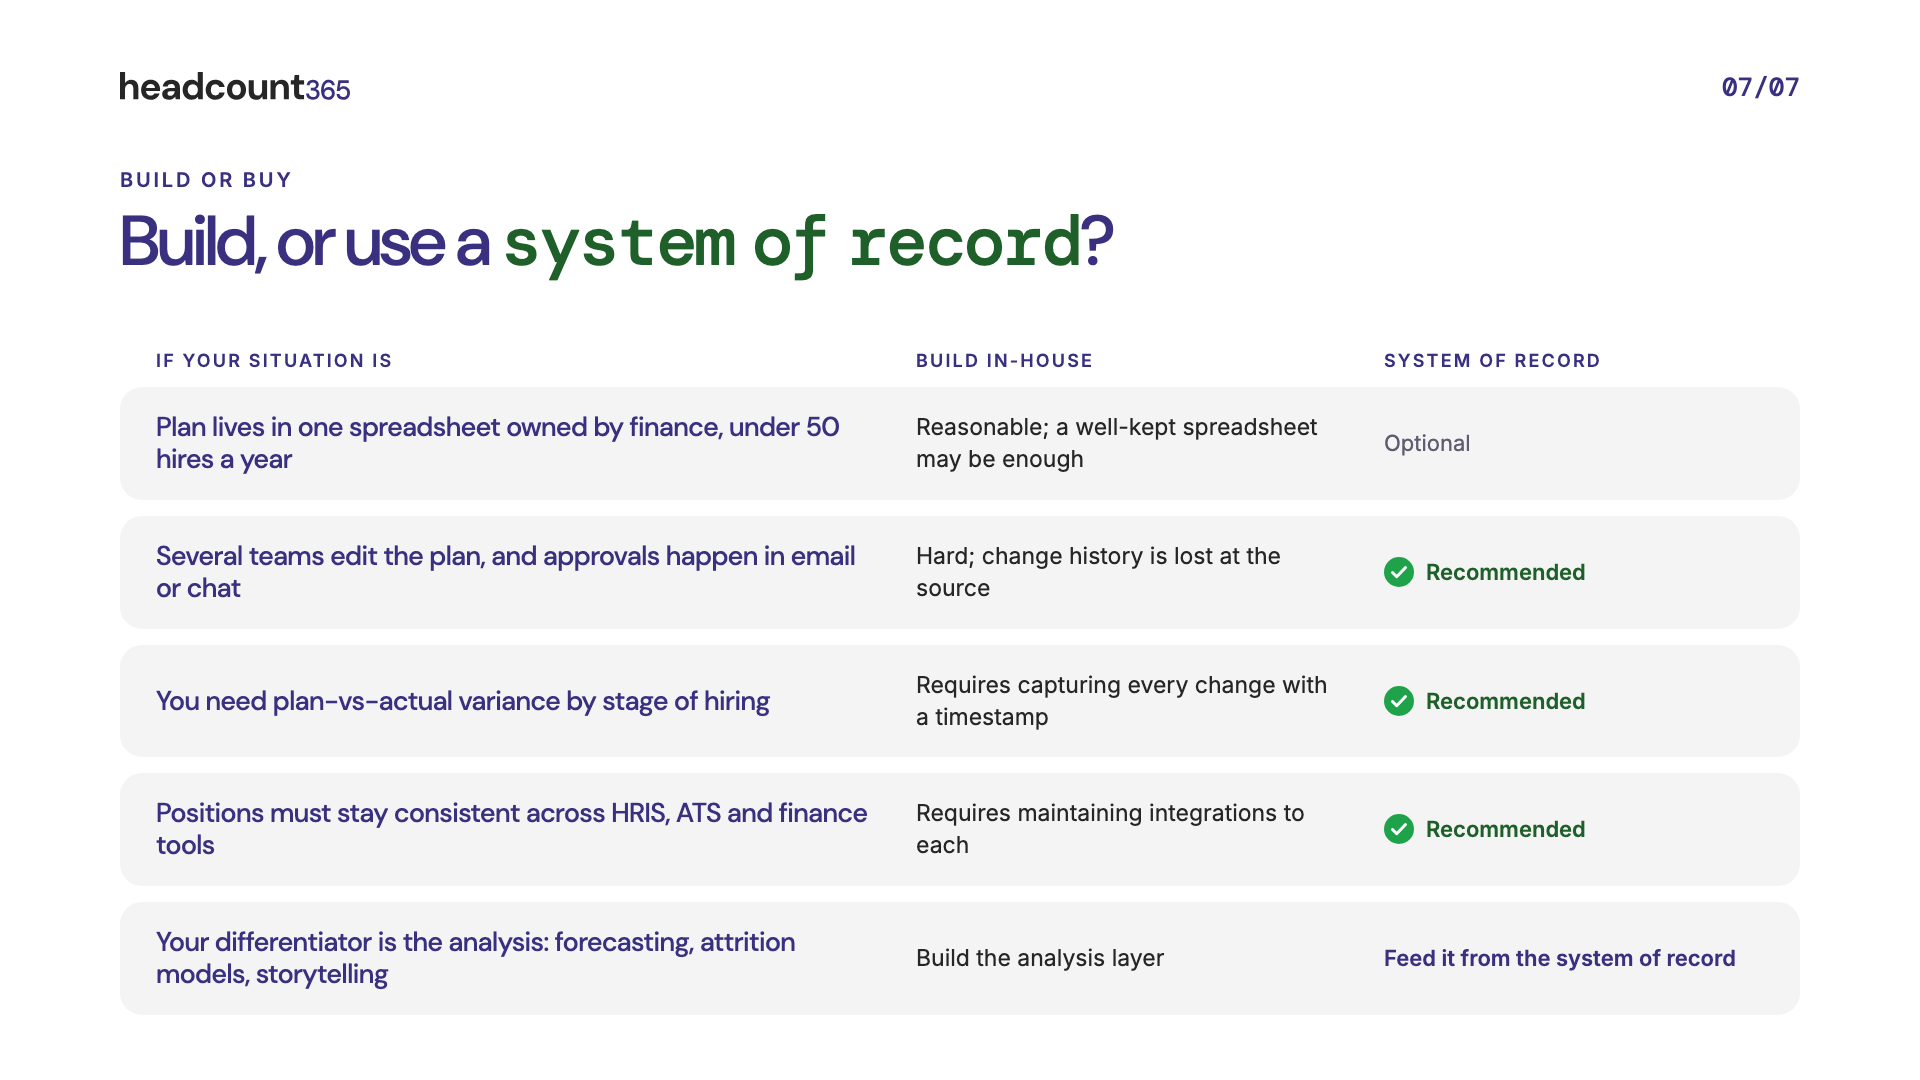
When to build your own headcount pipeline and when to use a system of record. Cole on being a data consumer rather than a data producer, at 31:10
Be a data consumer, not a data producer
Cole frames the choice by the analyst's role. A data producer builds and maintains the pipeline: extracting from each system, reconciling definitions and fixing breaks. A data consumer starts from clean data and spends the time on analysis. Starting as a producer, he says, is like "staring at the blank screen of 'we have no data infrastructure, now it's my job to fix that.'"
This matters more as the "talent engineer" title spreads, often filled by recruiters moving into technical work. Cole's view: "It's just data engineering. It's always been data engineering." It is hard work on hard data, and data engineers are in short supply. A new talent engineer will produce more value consuming a reliable headcount dataset than building one from scratch.
Team size points the same way. Cole estimates a small organization needs no more than about three people in people analytics, "plus a good technology stack," and that even a very large one is hard to justify above about 20. A small team cannot afford to spend its time producing data.
The last row is the split we recommend. Let a dedicated system capture the plan and its history. Spend the team's time on the models and recommendations that only it can produce.
What to ask of any headcount data source
Whether you build or buy, hold the data to the same standard:
Does it record the initial plan separately from the current plan?
Does it keep a timestamped history of every change, with who made it?
Does it link a backfill to the departure it replaces?
Does it count vacant seats until someone decides to close them?
Can you get the data out, in full, into your own tools?
If the answer to any of these is no, that gap will show up in your analysis later.
How headcount365 handles headcount data
headcount365 is a headcount planning system of record. It captures the plan, approvals and every later change as they happen, so the analysis layer starts from a complete history rather than a reconstruction.
The unit is the position. Each planned hire is a requisition on a plan year, typed as a new hire or a backfill. A backfill is linked to the employment record of the person who left.
Vacant seats stay counted. A departure synced from the HRIS leaves an open seat that stays in headcount and cost views until someone closes it, with a reason. A closed seat can be reopened.
Plan, forecast and actual are separate fields. Each requisition keeps an initial snapshot from when it went on the plan, the current expected values, and the actual values from the accepted offer, synced from the ATS or entered in the app. Once the hire is matched to the HRIS, the employee record sits alongside them.
Every change is recorded. Each requisition keeps a full history of who changed what and when, as it moves from draft through approval, recruiting, offer and start.
Reports are built on that history. Cycle-time reports give medians for approval time, preparation time, recruiting time and notice period. A risk report flags changes to title, level, salary and start date, and classifies each by the hiring stage it happened in. Spend reports cover existing and forecasted cost for the plan year.
Scenarios sit beside the plan. A plan year can have scenarios for testing alternatives without changing the approved plan.
Currency is explicit. Salaries are stored in local currency, with the currency code and the conversion rate applied.
The data leaves cleanly. It connects to HRIS and ATS systems, syncs to FP&A tools such as Pigment, and supports scheduled exports of requisition, employee and employment action data. [CONFIRM: whether to mention the MCP connector for AI assistants, currently enabled per customer.]
Recruiting start dates are worked back from the plan. Each requisition has an expected offer date, and each recruiter or recruiting team has a time to fill. headcount365 uses the two to show when recruiting needs to start, which is the date a backfill has to open to arrive in time.
Role Based Access Control. Each user sees only the positions their access allows.
-
The terms are often used interchangeably. Where they differ, HR analytics usually means measuring HR processes, such as time to fill, turnover and training completion. People analytics is broader: it connects workforce data to business outcomes like cost, revenue and delivery capacity, and it draws on finance and recruiting data as well as HR data.
-
Start with a reconciled count of positions: filled, open, on hold and vacant, each with a department, location, cost and expected start date. Add the change history of those positions next. With those two in place, most descriptive and diagnostic questions about hiring and cost can be answered before any survey or performance data is added.
-
Compare three values for each position: the initial plan, the current plan and the actual outcome. Initial against current shows slippage in start dates and changes in salary or level. Current against actual shows offer variance. Add cycle times for approval and recruiting, and you can see both whether the plan is late and where the delay is.
-
It is Cole Napper's model for how a people data function matures. Rather than a ladder from descriptive to prescriptive analytics, it describes the foundations a company needs to answer any people question well: connected source systems, governance, certified measures, domain context, and the ability to act on what the data shows. In his words, it is about "how to set up the right foundations to be able to scale to solve any type of problem."
-
They usually count different things. An HRIS counts employees on payroll today. Finance counts funded positions, including open and planned ones, often as cost over a period. Departures without a backfill, positions on hold and hires with future start dates all create gaps. Defining the position as the shared unit, and tracking its state, reconciles the two.
-
Early enough that the replacement is productive before the current employee leaves. Add the time to fill to the time a new hire takes to break even, and open the requisition that far ahead of the expected departure. This works best in roles with many incumbents and predictable turnover, such as inside sales or support, where you can forecast departures per quarter rather than guessing about one person.
-
Review at least as often as your plan changes. If roles change monthly and you review quarterly, you're always two months behind and the gaps pile up without explanation. Most teams review scorecards monthly and check plan attainment more closely in Q4, when the year's plan is either met or missed.
-
They usually fail for three reasons:
A single function owns them while other teams drive the outcome.
Reviews happen less often than the plan changes.
The gap between plan and reality is never explained.
Shared scorecards, regular reviews and a dated history of every change fix all three.
-
Link each hire's records across the hiring plan, the ATS and the HRIS. Then compare what was planned and paid with how the person performed:
How quickly they reached full productivity
Performance against goals
Tenure and promotions
Because the records are linked, you can trace results back to the recruiter, the hiring manager and the budgeted salary. The hard part is joining data from separate systems, not defining the metric.