New HR Analytics Created by Headcount Software
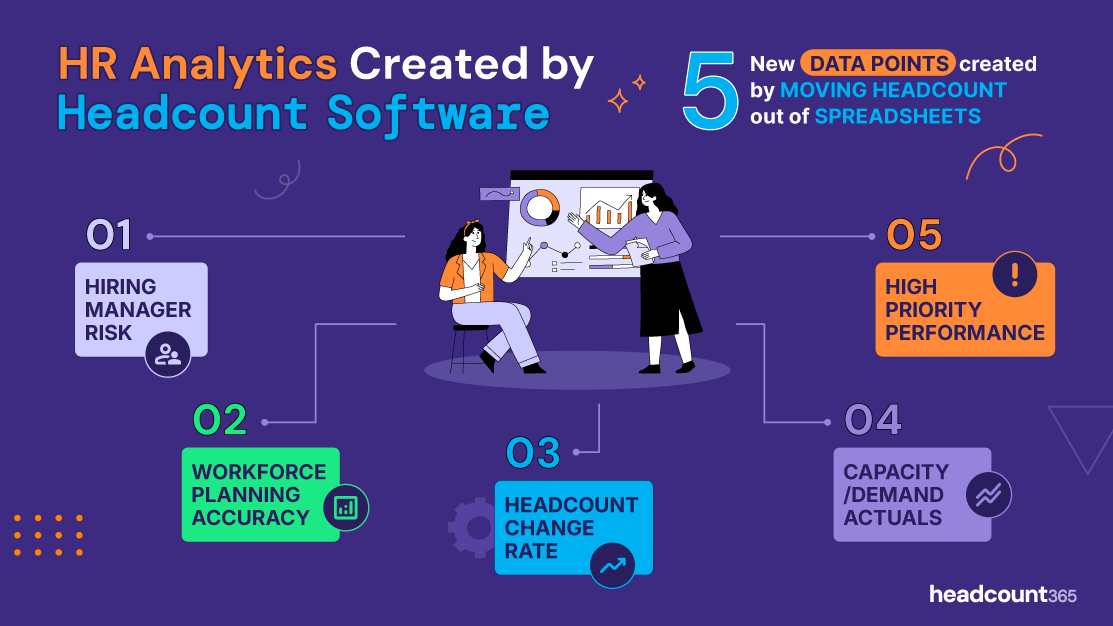
Table of Contents
HR Analytics Created by Headcount Software
Moving headcount out of spreadsheets creates five critical new data points for talent and finance leaders:
| ID | Analytic Category | Strategic Value |
|---|---|---|
| 01 | Hiring Manager Risk | Identifies risks associated with specific managers' hiring patterns or success rates. |
| 02 | Workforce Planning Accuracy | Measures the gap between the planned headcount and actual organizational growth. |
| 03 | Headcount Change Rate | Tracks the velocity and frequency of adjustments to the hiring plan. |
| 04 | Capacity / Demand Actuals | Compares real-time recruiting capacity against the current hiring demand. |
| 05 | High Priority Performance | Monitors the progress and success rate of the organization’s most critical roles. |
Source: headcount365
Any HR analytics dashboard, whether software or a spreadsheet can produce surface-level metrics from existing systems. Headcount365, & it’s HR Analytics founders, have created new data from headcount actions & results to tell a story of WHY.
5 new HR analytics from headcount data
This post explores five advanced HR analytics metrics created when you stop losing data from disconnected spreadsheets and systems. By eliminating disparate approval processes, financial reconciliations and individual requisition storytelling from spreadsheets and other systems, you get 5 brand new metrics.
1. Hiring Manager Risk
Which hiring managers create the most cultural debt for your organization?
What it is:
This metric captures the number of actions hiring managers take that introduce organizational risk or cultural debt.
Why it was previously impossible to capture:
Hiring managers make changes. They combine roles into one bigger roles (or split them). They change levels. They use compensation from terminations to uplevel a role. They go above band on offer. The list continues. Before headcount365, this data was not tracked and definitely not consolidated into an easy-to-digest report about hiring manager risk.
Why it matters:
Culture gets destroyed when expectations are mismanaged. Some common issues that create this cultural debt are:
Salary Variance: Paying people with the same title different salaries
Title Variance: Paying the same salary to employees with very different levels or responsibilities
Management Ratios: Shifting team ratios without oversight (e.g. adding ICs without managers)
These inconsistencies create downstream problems for compensation equity, performance management, and team effectiveness. With HR analytics software like headcount365, this activity is no longer invisible.
2. Workforce Planning Accuracy
How good is your business at workforce planning?
What it is:
This metric tracks variance from your original headcount plan—across cost centers, departments, and individual roles.
Why it was previously impossible to capture:
When a hiring manager changes a cell on a spreadsheet, there is no record of that change. Finance-led reforecasts often make hundreds of “old” spreadsheets obsolete as hiring teams work off this new baseline for demand. As the recruiting team changes in size, or becomes more productive in the age of AI, the capacity to hire changes. Spreadsheets and disparate systems are not configured to consistently track the headcount target, changes to that target, and all progress against.
Why it matters:
The most accurate forecasts factor in changes. A clear history of how inputs (sales, new locations, attrition) impact your ability to meet headcount will help you create a better forecast
Recruiting Capacity: Is the recruiting team staffed to hire the demand you are asking for?
Production Capability: Do we have enough employees to meet the demand we’re asking of the business
Revenue: Can we accurately forecast revenue from hiring?
This is foundational for hr transformation and analytics because it moves beyond reporting on "what happened" to measuring alignment with strategic intent.
3. Headcount Change Rate
How much does your headcount plan change, and how does it impact the business?
What it is:
The number and timing of changes made to the headcount plan after it’s approved.
Why it was previously impossible to capture:
For the same reason as above—- theres no tracking of changes to a spreadsheet. All of the data about that change is lost (unless you’re very diligent in the notes column of your spreadsheet— and even then— good luck remembering the context of years past)
Why it matters:
Timing reveals four critical breakdowns:
Before recruiting starts → Poor planning
During recruiting → Disrupted workflows
During offer stage → Misaligned candidate expectations
Compensation changes → Ineffective compensation frameworks
This is a powerful layer of hr data analytics that shows where hiring processes break down—and why.
4. Capacity/Demand Actuals
Can the service of internal recruiting meet the demand of the business?
What it is:
A measurement of actual recruiter output against business demand.
Why it was previously impossible to capture:
Recruiting capacity is dynamic. Teams have attrition and new recruiters ramp. Individual recruiters have different workload difficulties. Hiring managers get in the way. Finance teams reforecast. Tracking at an executive level the demand vs capacity in historical context can not be done in spreadsheets.
Why it matters:
It helps you understand if the recruiting team can meet the volume requested by the business—without relying on agencies or risking burnout. Historical comparisons between demand and delivery enable more accurate workforce planning and better alignment between Finance and Talent Acquisition.
Subjective Performance Bias: If a recruiter is expected to fill 4 hires in a month, and a hiring manager asks them to fill 10, the hiring manager may perceive the recruiter as underperforming if they don’t fill all 10
Recruitment Project Planning: Forecast your ability to meet not production goals
Recruiter Workload Balancing: Two recruiters filling 10 jobs each don’t necessarily work the same amount. Things like job level, candidate scarcity and other factors impact the difficulty of their work
5. High Priority Performance
How does the business do at hiring the highest priority roles?
What it is:
How well the recruiting team delivers on the highest-priority roles.
Why it was previously impossible to capture:
If everything’s a priority, nothing is, and while spreadsheets do offer this capability, headcount365 offers a significant improvement to the fidelity of the data, using metrics from above to enrich the data and tell a better story.
Why it matters:
Boards, Executives and high maintenence hiring managers have more questions about P0 roles, that are not captured in any other system. Not all roles are equal. This metric focuses on:
High-priority time to fill & on-time starts
Utilization the high priority system relative to total demand
P0 vs all other reqs stat comparision
If HR analytics can’t tell you how you’re performing on top-priority roles, it’s not useful.
headcount365 changes the game for HR Analytics
Most HR analytics software only sees the data your HRIS or ATS can export. Headcount365 adds the missing context. It captures the story behind your plan, your reqs, and your org chart. This is what real hr transformation and analytics looks like—data that tells you what’s broken, and how to fix it.