4 Alternative Ways to Calculate Cost Per Hire
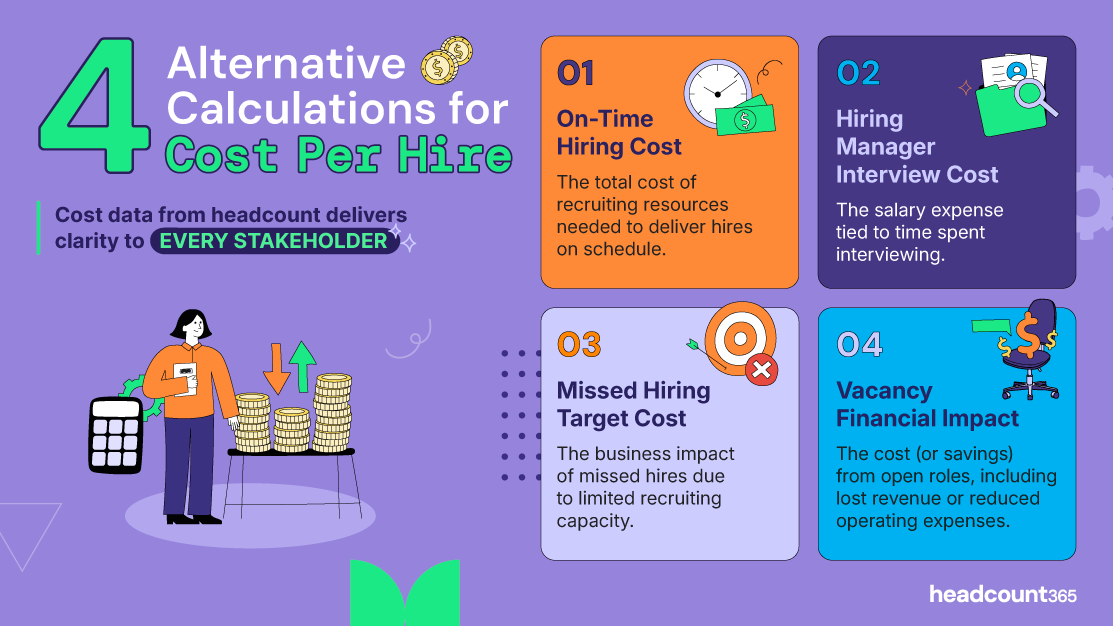
Table of Contents
4 Alternative Calculations for Cost Per Hire
Cost data from headcount delivers clarity to every stakeholder. Beyond traditional metrics, these four calculations provide a deeper understanding of the financial impact of recruiting.
| ID | Calculation Metric | Definition & Business Impact |
|---|---|---|
| 01 | On-Time Hiring Cost | The total cost of recruiting resources needed to deliver hires on schedule. |
| 02 | Hiring Manager Interview Cost | The salary expense tied to the time managers spend interviewing candidates instead of performing their primary roles. |
| 03 | Missed Hiring Target Cost | The measurable business impact and loss resulting from missed hires due to limited recruiting capacity. |
| 04 | Vacancy Financial Impact | The total cost (or savings) generated by open roles, including lost revenue or reduced operating expenses (OPEX). |
Source: headcount365
Specific cost-per-hire calculations for every stakeholder
Calculating Cost Per Hire with a single formula does provide directional spend intelligence to a broad set of stakeholders, but does not answer the specific questions each individual stakeholder has about their cost of headcount & recruiting.
Executives, Finance, and department heads all care have different cost drivers, such as timing, vacancy impact, and interview load. While headcount365 provides more specific intel for each, this article will guide you through the manual calculations of 4 different cost per hire calculations—each designed to give stakeholders the answers they actually need.
1. On-Time Hiring Cost
Recruiting capacity is linear, but hiring demand seldom is. Hiring teams want their new hires by the date they originally forecasted but make these requests in a silo, without considering the overarching recruiting capacity. We often see recruiting teams with front loaded plans, or with spikes in demand that need resolution, and TA leaders need to be able to calculate the cost of on time hiring.
Calculate the cost, explain the ROI
Calculating the cost of spikes in demand: Keeping costs flat usually means moving start dates. If the business insists on start dates, options include agencies, additional full time recruiters, contractors of some combination of all 3.
Calculating ROI for Recruiting costs: Recruiting budgets typically bear the burden of all recruiting costs, but calculating ROI helps get funding from other departments. Taking the same logic from our Article on Predictive Backfills calculating the lost revenue or production from a missed hire date helps justify the spend.
Why it matters:
Recruiting Leaders bear the full burden of production, regardless of the inputs from the business. It’s not a hiring managers/leader’s job to understand recruiting capacity & the cost impacts of start dates, so it’s your job to model this out. Outside of unlocking budget, you earn their understanding of how the service of recruiting works so they encourage their team to be more productive with recruiting.
headcount365’s capacity demand forecast helps managers recruiting leaders spot variance in recruiting capacity vs demand. Our on-time hiring report automates the calculation of cost & ROI so executives understand the impact of hiring on-time
2. Hiring Manager Interview Cost
One of the largest constraints to hiring, is the availability of hiring managers for interviews. Hiring one candidate can take as much as 20 hours of hiring manager time, across resume review, filling out scorecards, and the interviews themselves. In scale ups—this can be the biggest constraint as hiring managers need to balance growing their team with the production expected by the business.
The hiring manager Interview Cost metric is essentially salary cost of time spent by hiring managers in interviews, given your current interview process, funnel conversion rates, and interview-trained staff.
Calculate HM interview cost, explain the ROI
Calculating the cost of hiring manager interviews: Each interview process has a certain number of interview hours. The total openings and the funnel conversion rates will help estimate the number of hiring manager interview hours needed. Multiply this number by the average salary of your interviewing team and you’ll have an estimate of the cost for hiring manager interviewers
ROI for reducing hiring manager Interview costs: Interviewers can create busienss value. Sellers sell. Engineers code. They can be doing any number of tasks to drive profitability. Associating an opportunity costs to interviewing is great justification for a more efficient interview process (Competency based interviewing, Less steps, AI tooling)
Why it matters:
Hiring isn’t just a Talent Acquisition expense. When directors and VPs spend hours in interviews, that time has real dollar value. This metric helps quantify the “hidden” cost of hiring, especially in fast-growing orgs with high-volume needs or misaligned funnels.
headcount365’s hiring manager encumbrance tracking helps identify hiring managers who are blocking recruiting, quantifying the impact of hiring actions to more quickly remedy any blockages
3. Missed Hiring Target Cost
A delayed salesperson’s start date means delayed revenue. Delayed engineers is delayed product. Calculating the impact of missed hiring helps unlock recruiting resources, and often lights a fire under hiring teams to follow process, and prioritize recruiting.
Calculate missed target cost, explain the ROI
Calculating the cost, or savings or missed recruiting: Finance leaders might appreciate the OPEX savings from missed hiring at the very same time a hiring manager is upset they didn’t get someone on time. As a Recruiting Leader, you’re facilitating their conversation about the best way to move forward by providing the data. Finance, want’s to know how much OPEX was saved from delayed start dates, and Budget owners want to know the lost production.
Using Missed Targets in Practice: The calcuation is only half the story. Both parties will want to know WHY and have a way to fix it. If missed targets are a function of recruiting capacity, it’s a great time to ask for more resources. If missed targets come from hiring team inefficiency, it’s a great time to earn the Budget Owners buy in for behavior change with hiring teams.
Why it matters:
When you miss your hiring target, the cost isn’t just unspent budget—it’s unmet revenue goals, delayed product timelines, and lost growth. This metric puts a dollar value on those missed opportunities, helping Finance and Execs see why TA capacity is a business investment, not a sunk cost.
headcount365 has real-time in-year spend tracking so FP&A leaders can track OPEX from missed hires. Our headcount AI automatically reforecasts missed hire dates to, recaculating this number without manually updating spreadsheets. Each requisition comes with a summary of why it’s in it’s current position
4. Vacancy Financial Impact
The cost of attrition calcuation, helps companies balance investments in employee tenure. When people leave, they stop earning their salary, and also create gaps in production. As HR & FP&A teams build their plans for the future, incorporating in the impact of vacancies help them adjust their policy and spend on attrition.
What it is:
The tactical calculation is the OPEX savings and Revenue/Production loss from each individual seat, but different stakeholders apply this calculation to more complex processes.
HR leaders will use this calculation to associate costs of onboarding, training, and cultural impact.
Finance teams will factor in ramp, revenue and commission.
Recruiting Leaders: Backfill Requests are unplanned demand on their recruiting capacity.
Why it matters:
Attrition is complex in that it makes an impact on the near term financials, but can also be healthy. Productivity per employee changes over time, and attrition can be a welcome reset of culture. Understanding tangible costs help HR & Finance balance their investments and maintain a healthy level of attriton.
Some vacancies hurt the business (e.g. lost sales), while others save money (e.g. paused hiring during budget pressure). This metric lets you model both.
headcount365 has a real-time connection to the HRIS & ATS data, so you can see vacancy impact across departments, functions, or locations and make smarter decisions about where to pause—or accelerate—hiring.
Calculating Cost Per Hire isn't one-size-fits-all
Cost per hire can be a powerful tool to help better manage the process of recruiting. Different stakeholders care about different slices of cost. These alternative calculations help quantify a more subjective part of the hiring process and earn Recruiting Leaders buy in with Hiring Managers, FP&A leaders and HR.